TOP It Here: A Guide to Nearly All Linux *top Utilities
A comprehensive overview of practically all *top utilities for Linux — atop, iotop, htop, powertop, iftop, and many more — explaining what each one does and when to use it.
An overview of practically all top utilities for Linux (atop, iotop, htop, foobartop, etc.).
top
We all know top — the simplest and most common utility on this list. It shows roughly the same information as the vmstat utility, plus a ranking of processes by memory or CPU consumption. It knows absolutely nothing about network or disk load. It provides a minimal set of operations on processes: renice, kill (in the sense of sending a signal — killing is just a special case). The suffix "-top" in all the other utilities in this review comes from the name "top".
atop
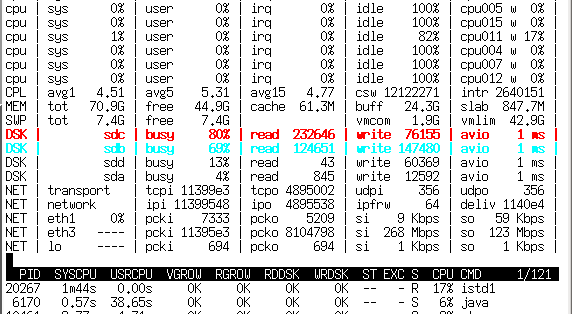
Atop has two operating modes — statistics collection and real-time system monitoring. In statistics collection mode, atop runs as a daemon and dumps the system state to a binary log every N minutes (usually 10 min). You can then navigate back and forth through this log using atop itself (with the -r flag and the log filename), pressing T and t to view atop readings averaged over 10 minutes at any moment in time you're interested in.
Unlike top, it knows perfectly well about block devices and network interfaces and can show their utilization as percentages (on 10G interfaces it can't really show percentages, but at least it displays the number of megabits).
An indispensable tool for finding the sources of lag on a server, since it saves not only system load statistics but also metrics for every process — meaning that by "scrolling" to the right moment in time you can see who created that happy moment with LA > 30. And what exactly was the cause — program I/O, swap (memory shortage), CPU, or something else. In addition to more information, it can also use two colors to hint which parameters are exceeding reasonable limits.
htop
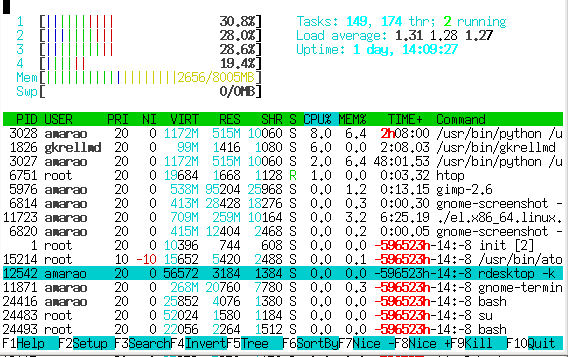
Unlike atop, htop doesn't collect statistics and simply shows the current state. The second notable difference is a Norton-Commander-like panel with button hints at the bottom and the ability to "navigate" through the process list.
It supports selecting processes and performing group operations on them (though it still can't handle a fork bomb).
It shows little overall system statistics (but with a nice progress-bar-style gauge), while having extensive tools for process analysis, including playing with scheduling (priorities, affinity), viewing lists of open files, strace, and a host of small but pleasant features such as contextual search by process name, process "tracking" mode, quick process operations, etc.
iotop
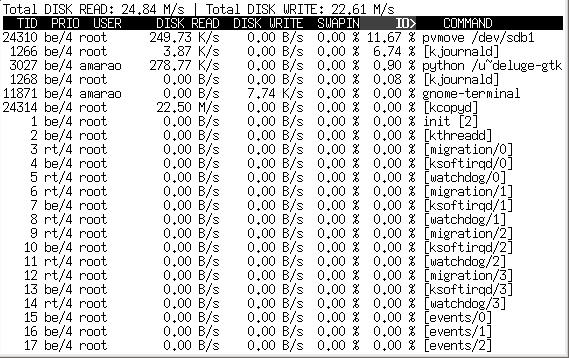
A specialized utility for analyzing disk bandwidth consumption. Unfortunately, it doesn't show IOPS (is that even possible?). Thanks to showing kernel threads, it can point to kcopy/swapper/kflush as the source of disk thrashing (which atop cannot do). It also shows overall I/O system load in MB/s (which atop also cannot do). Pretty fast.
iftop
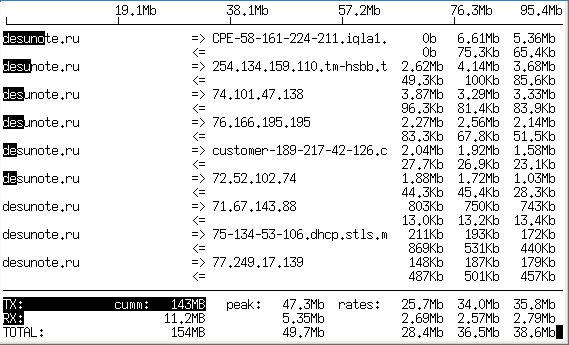
Again, a specialized utility that lets you watch network traffic in real time. It requires root privileges and pcap, as it works almost identically to tcpdump. It shows interface utilization (only one interface per instance is supported), traffic directions, and traffic intensity.
On a moderately loaded server that suddenly started eating up bandwidth, it lets you very quickly find the direction where most traffic is going (in either direction). Unfortunately, it doesn't show traffic distribution by process.
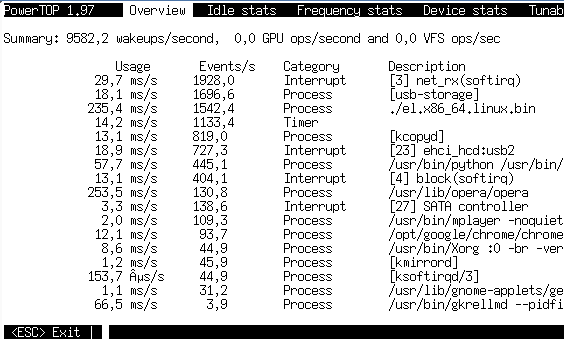
powertop
A specialized (yep, again) utility from Intel for monitoring power consumption (electrical power!) by different processes. In reality it doesn't show any watts — it shows the time spent by the CPU servicing processes. It's unique in that it shows interrupts and other kernel events on the same level as processes (which helps find non-trivial server overload situations and even determine which piece of hardware is the source). Under equal load, it helps assess whose driver is faster.
Additionally, in the "device stats" tab it lets you assess device (or rather, device driver) load. For network cards (including virtual ones, like tun) it shows PPS (packets per second).
In the "idle status" tab it shows the distribution of processor states (C1, C2, C3), which is very useful for figuring out "is the battery dying or is something wrong with the system?" on laptops.
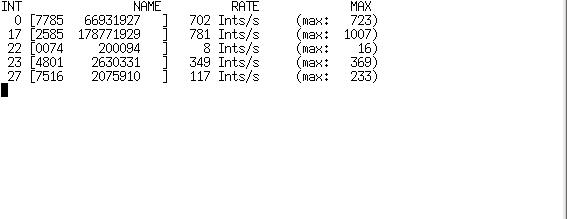
itop
A very specialized utility for monitoring interrupts (real interrupts, identified by number).
kerneltop
Presumably should show something interesting about the kernel. On my home machine it didn't like System.map, and on the server it complained about the absence of /proc/profile.
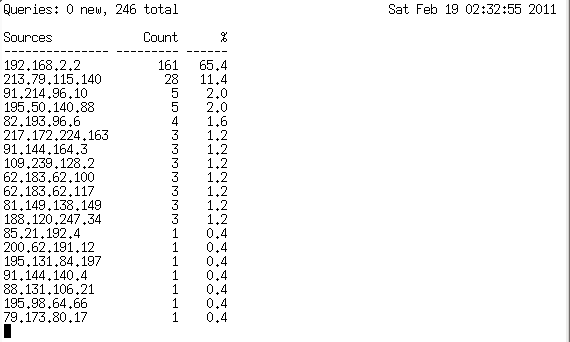
dnstop
A specialized DNS traffic analyzer for a network interface. It would probably be very useful when fixing DNS on a domain controller — unfortunately, Active Directory doesn't work very well on Linux.
Certainly useful for finding the culprit pushing BIND into unreasonable load average.
jnettop
Almost a clone of iftop, but it has a fun mode where it can listen to neighbors and show a top by their traffic. Doesn't work very well in the age of switches.
It also supports address aggregation (so it can display their traffic in a single line).
sntop
A wonderful thing for a screensaver or a public display — based on a config file, it sends pings and shows when a host goes down. In practice, with a configured config file, it lets you quickly assess the state of a not-too-large server fleet (launch it — and immediately see in red who's down).
latencytop
I would have loved to look at it, but it requires a special kernel config...
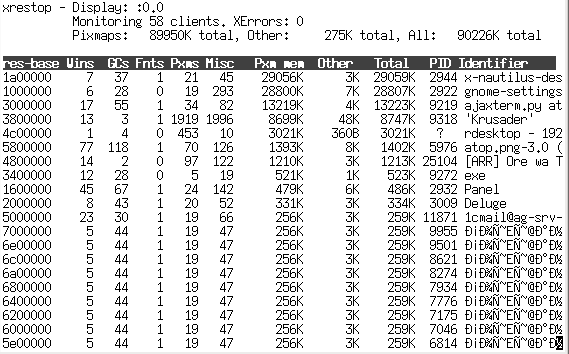
xrestop
Monitors X server resource consumption by different applications connected to it. (I discovered that Chrome eats up way more X server resources than Opera.)
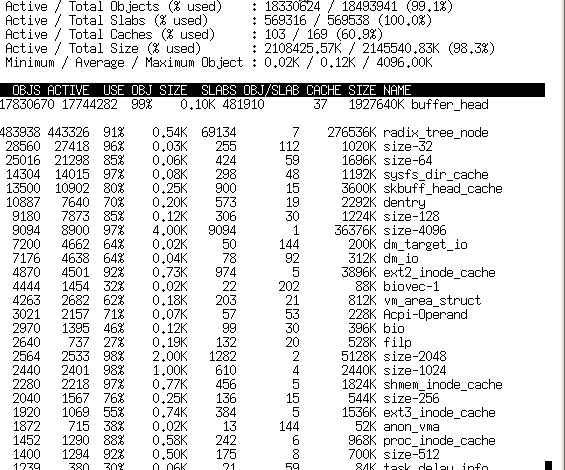
slabtop
Specializes in kernel SLAB data structures — essentially shows memory usage in finer categories than "free/used/cache". View only, several sort modes.
Software-Specific
apachetop
Not as useful as you'd hope — it shows response statistics for requests. No magic involved, it simply reads Apache logs.
sqtop
A top for Squid logs. Given how fast they grow, it first generates intermediate statistics and then lets you browse through them.
pg_top
The Debian package is called ptop for some reason. Monitors PostgreSQL load.
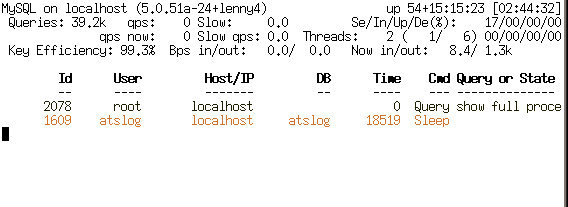
mytop
Monitors MySQL. There's an alternative called mtop that does roughly the same thing, but it's been abandoned and was removed from Debian around lenny → squeeze.
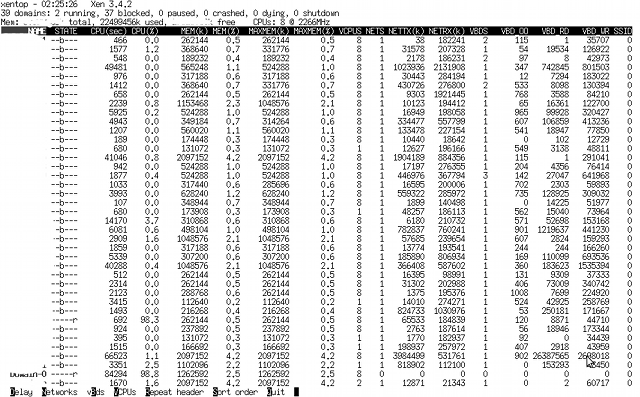
xentop
Monitors Xen domains. Interesting in that it shows not only memory and CPU, but also disk operations and networking. Unfortunately, no management — view only. The only top utility that doesn't fit within 80 columns of output.
A list of tops I haven't looked at with my own eyes:
- hatop — haproxy monitoring
- virt-top — libvirt monitoring
- mctop — memcached status monitoring
- perf-top — I found the documentation, but couldn't find perf-top itself as a tarball or package.
offTOP
First, the false tops in brief:
- gkrelmtop — a plugin for GKrellM (a GUI performance monitor) — off-topic.
- ntop — breaks the text-based tradition of interactive programs and installs as a website for Apache.
- libgtop — a library for performance monitoring.
- nload — a console network activity monitor that, unlike typical top utilities, doesn't display a ranking but draws a text graph.
And now the real tops without the respectable 'top' suffix in their name.
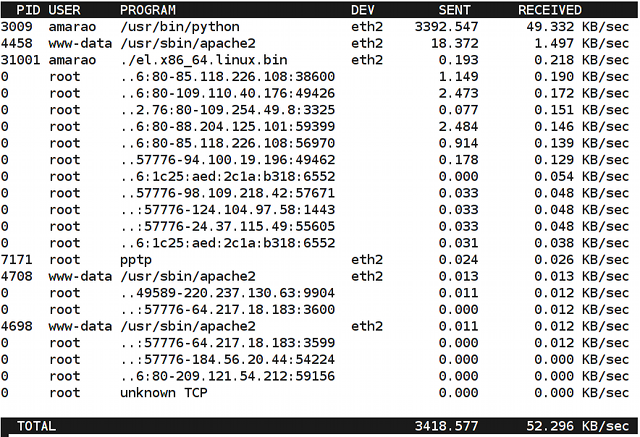
nethogs
Displays network traffic from specific applications.
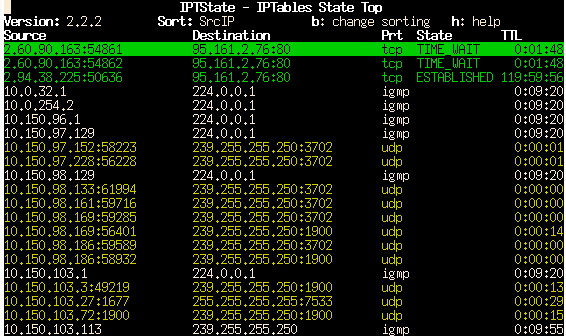
iptstate
An iptables conntrack monitor that shows active translations with the ability to kill them. Essentially similar to Cisco's sh ip nat tra, but more convenient.