Memory of Depth: Submerging Lithium Batteries to 1,500 Meters
An experimental study of LiFePO4 18650 batteries subjected to hydrostatic pressures up to 14 MPa (equivalent to 1,400 meters depth), revealing that the cells continue to function and even show a statistically significant increase in discharge energy under pressure, with a minor but measurable hysteresis effect.
Greetings, deeply esteemed readers!
My grandfather says: do good and cast it into the water. — from the cartoon "Oh, a Talking Fish!"
Today everything runs on lithium. We even drag lithium underwater, but along with it we haul complex, heavy, and expensive pressure-rated (normobaric) housings. The question arises: are we actually protecting the batteries from the environment, or are we just following tradition without knowing their real capabilities under pressure? The result of our experiment was a pleasant shock.
Below the fold: 150 kilograms per square centimeter, batteries, strength of materials, and a 55mm wrench.
0. Intro
This work was not born of idle curiosity. Developers of underwater technology — hydroacoustic communication systems, navigation equipment, underwater robots — need reliable power sources. Underwater, where there is plenty of work for various equipment, it is typically cold, dark, and frightening. Mass-produced battery designs are optimized for standard terrestrial conditions. High hydrostatic pressure is an exotic factor that is simply not considered when designing ordinary cells.
There are a few scientific publications on the effects of high pressure on Li-Ion and Li-Po batteries, but they primarily cover prismatic cells. Regarding lithium iron phosphate (LiFePO4), there is essentially nothing in the literature, so we decided to fill this gap ourselves.
1. What, How, and Why We Measured
Goal: determine to what depth LiFePO4 batteries can be used without a normobaric housing (one that isolates the internal volume from external pressure).
Why does this matter? A normobaric housing adds substantial size, weight, and cost. At depths beyond 600 meters, plastic "creeps," metal corrodes, stainless steel is difficult to machine, and aluminum requires anti-corrosion treatment. Eliminating the pressure housing would be a significant win for underwater system designers.
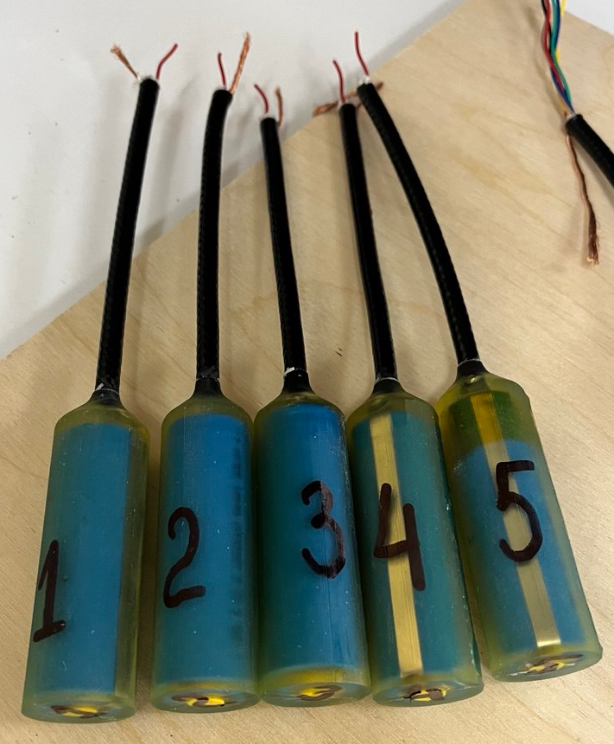
Sample Preparation
Five new LiFePO4 18650 cells with a rated capacity of 2,000 mAh were cast in a polyurethane shell (3 mm thick, 90 Shore A hardness). Five is not a statistically impressive sample, but it was the maximum that the hydrostatic chamber and cable design could accommodate.
Why Polyurethane Does Not Shield the Cells
The soft polyurethane shell provides virtually no pressure relief to the battery casing. The calculations show:
- Radial stiffness of the battery (steel cylinder, E = 200 GPa): approximately 1.98 × 10⁹ N/m
- Radial stiffness of the shell (EPU = 20 MPa): approximately 2.5 × 10⁶ N/m
- Fraction of load borne by the shell: approximately 0.13%
The polyurethane absorbs roughly one-tenth of one percent of the load. The battery experiences the full hydrostatic pressure.
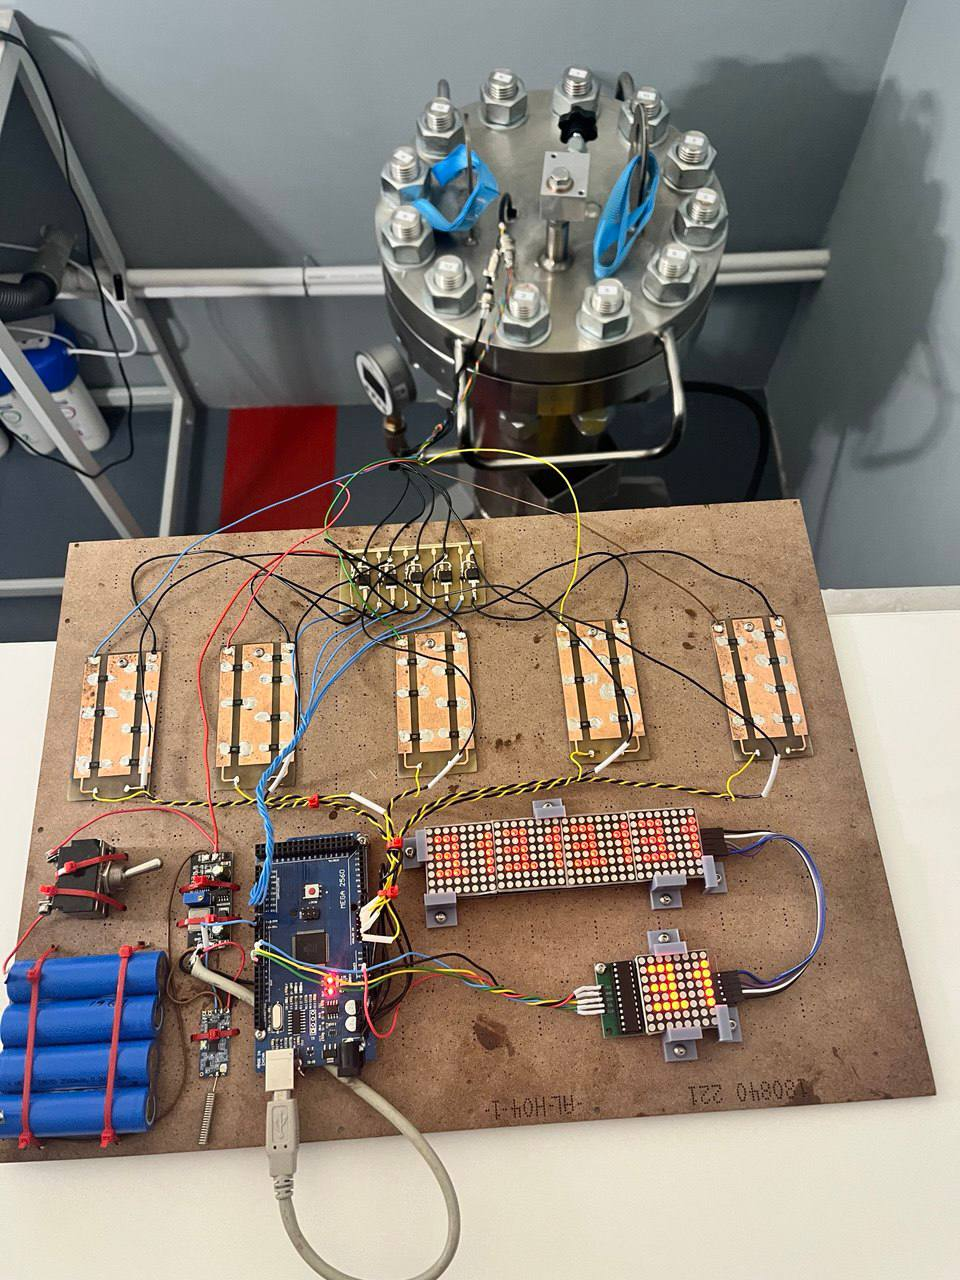
Test Setup
- Hydrostatic chamber lid: approximately 50 kg, secured with a chain hoist
- 12 M32 studs (tightened like lug nuts on a truck)
- Seals: PTFE (main seal), copper (small fittings)
Experiment Protocol
Pressure range: 0 to 14 MPa in 2 MPa increments (equivalent to 0 to 1,400 meters depth).
At each pressure level:
- Charge cells at 1 A to 3.6 ± 0.1 V
- Discharge cells at 390 ± 3.9 mA to 2.2 ± 0.05 V, with measurements every 5 seconds
Pressure control: calibrated digital manometer TsM-I-521R (0–16 MPa range, accuracy class 0.25), with an uncertainty of ±0.5 bar (±5 meters depth equivalent).
2. Results
The most important result: not a single battery was damaged. All five remain fully functional.
Voltage was measured every 5 seconds for all 5 cells over 4+ hours of discharge, across pressure steps from 0 to 14 MPa.
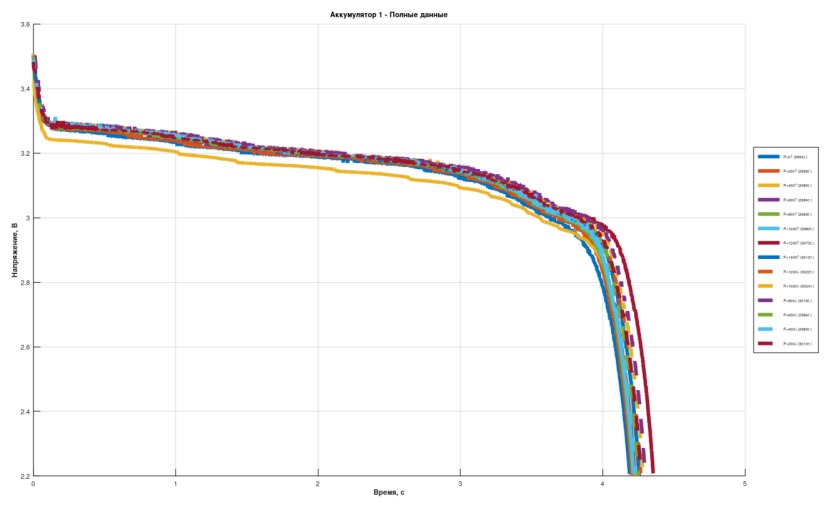
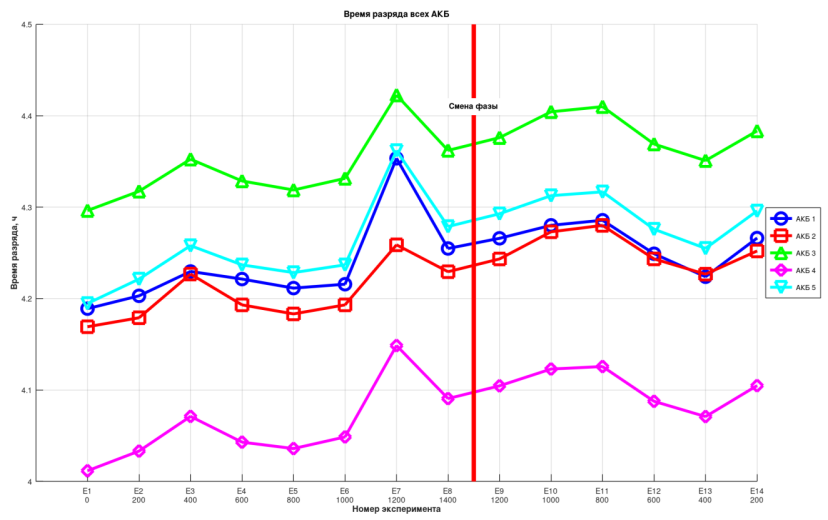
At first glance, the discharge curves look largely uninformative. There is an increase in discharge time with pressure, but no immediately obvious pattern.
Statistical Analysis
We applied Pearson correlation, p-value significance testing, linear regression, and F-statistics to assess model adequacy.
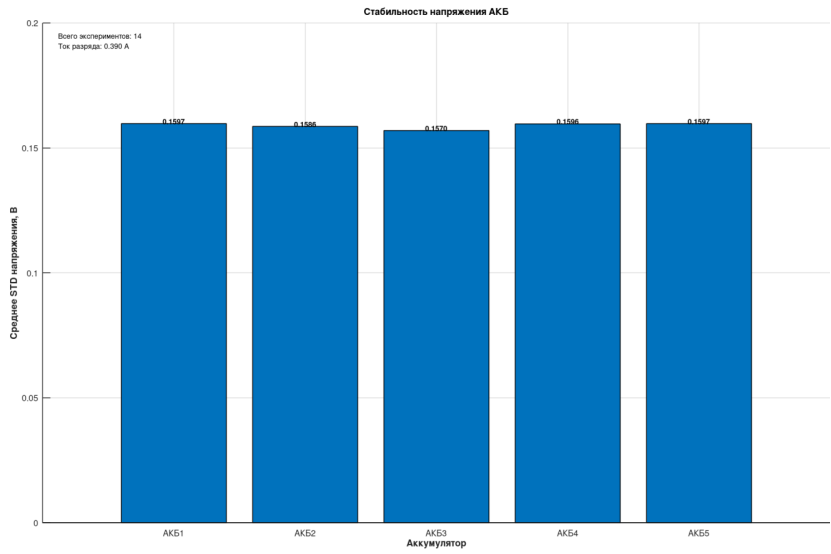
The standard deviation of voltage across the five cells varies within 0.01 V, confirming that the measurement circuits are essentially identical.
Key Observation: Hysteresis
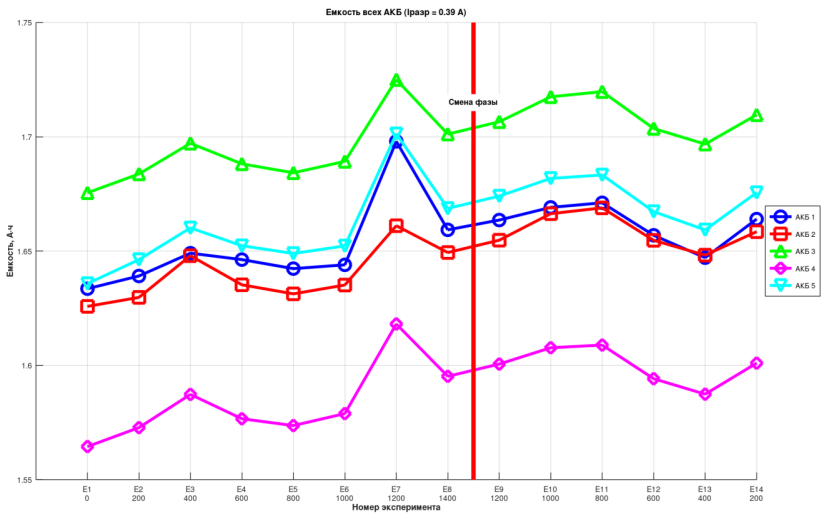
Discharge duration and energy increase as pressure rises, but when pressure is subsequently reduced, these values do not return to their original levels. One can suspect the presence of hysteresis.
Quantifying the Hysteresis
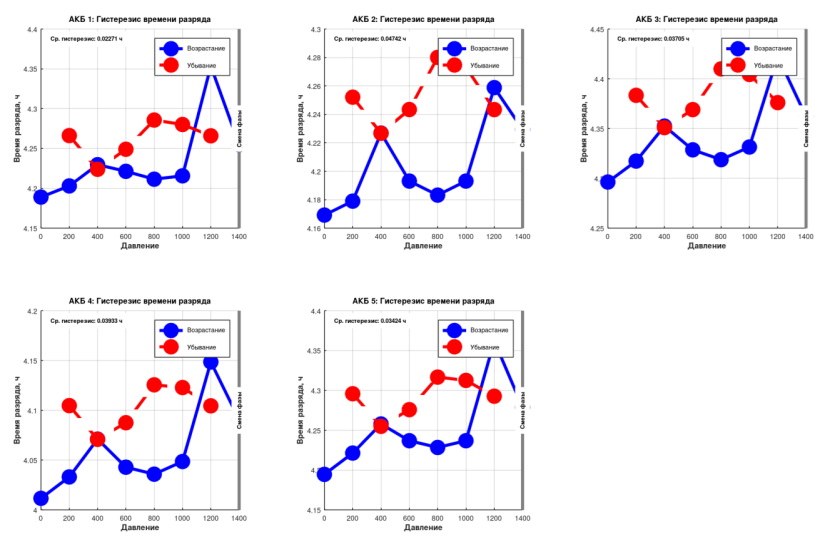
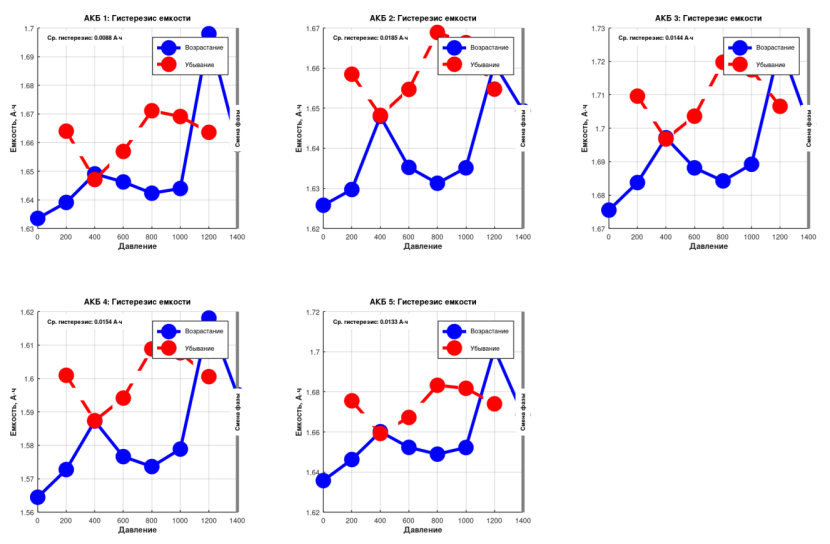
Hysteresis measurements for each cell:
- Cell No. 1: capacity hysteresis 0.0088 Ah (0.44%), time hysteresis 82 seconds
- Cell No. 2: capacity hysteresis 0.0185 Ah (0.93%), time hysteresis 170 seconds
- Cell No. 3: capacity hysteresis 0.0144 Ah (0.72%), time hysteresis 133 seconds
- Cell No. 4: capacity hysteresis 0.0154 Ah (0.77%), time hysteresis 142 seconds
- Cell No. 5: capacity hysteresis 0.0133 Ah (0.67%), time hysteresis 123 seconds
Qualitatively, hysteresis is present. Quantitatively, it is negligible. On average, the batteries held their charge for roughly 100 seconds longer when returned to atmospheric pressure. Compared to 4+ hours of total discharge time, this is truly insignificant.
Correlation Matrix
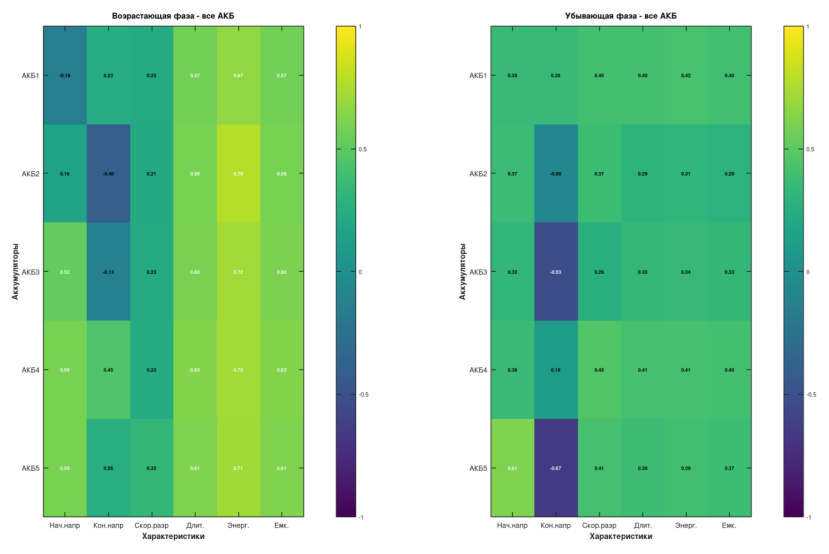
Initial and final voltages show no correlation with pressure, as expected — these are reference parameters set by the protocol.
Statistical Significance
A statistically significant relationship (p < 0.05) was found between pressure and discharge energy for 4 out of 5 cells during the pressure-increase phase:
- Correlation coefficients: r = 0.71–0.78
- Coefficients of determination: R² = 0.66–0.79
- Strongest result (Cell No. 2): r = 0.78, R² = 0.79, p = 0.005
This means that 79% of the variation in discharge energy can be explained by the change in pressure.
3. Conclusions
3.1 The Bottom Line
Yes, the batteries work under external pressure of 14 MPa — they charge and discharge normally.
Yes, there is a statistically significant positive correlation between external pressure and battery energy capacity. This is broadly consistent with existing research on Li-ion and Li-Po cells.
3.2 Why Does Pressure Increase Capacity?
(The authors are not electrochemists, so these are hypotheses only):
- Improved contact: External pressure improves contact between electrodes, current collectors, and the separator, increasing conductivity
- Porosity modification: Pressure modifies the porous structure of electrodes and separator, improving electrolyte distribution and increasing effective contact area
- Enhanced diffusion: Lithium ion diffusion rate increases under pressure
- Caveat: Excessive pressure could reduce separator porosity to harmful levels
3.3 Statistical Significance
The sample is small (n = 5), but the statistics show:
- Pressure-increase phase: significant correlation for 4 out of 5 cells (p < 0.05)
- Pressure-decrease phase: correlations weaken or disappear
- Explanation: the system is in a different structural-mechanical state after experiencing peak pressure
3.4 The Hysteresis Effect
Capacity hysteresis: 0.44–0.93%. Time hysteresis: 82–170 seconds.
The cause is most likely irreversible deformation somewhere — the external geometry has changed, and possibly the internal structure (e.g., separator porosity) has been altered.
3.5 Future Work
- Increase sample size
- Test at different temperatures (especially low temperatures to simulate real underwater conditions)
- Endurance testing (effect of pressure cycling on longevity)
3.6 One More Important Detail
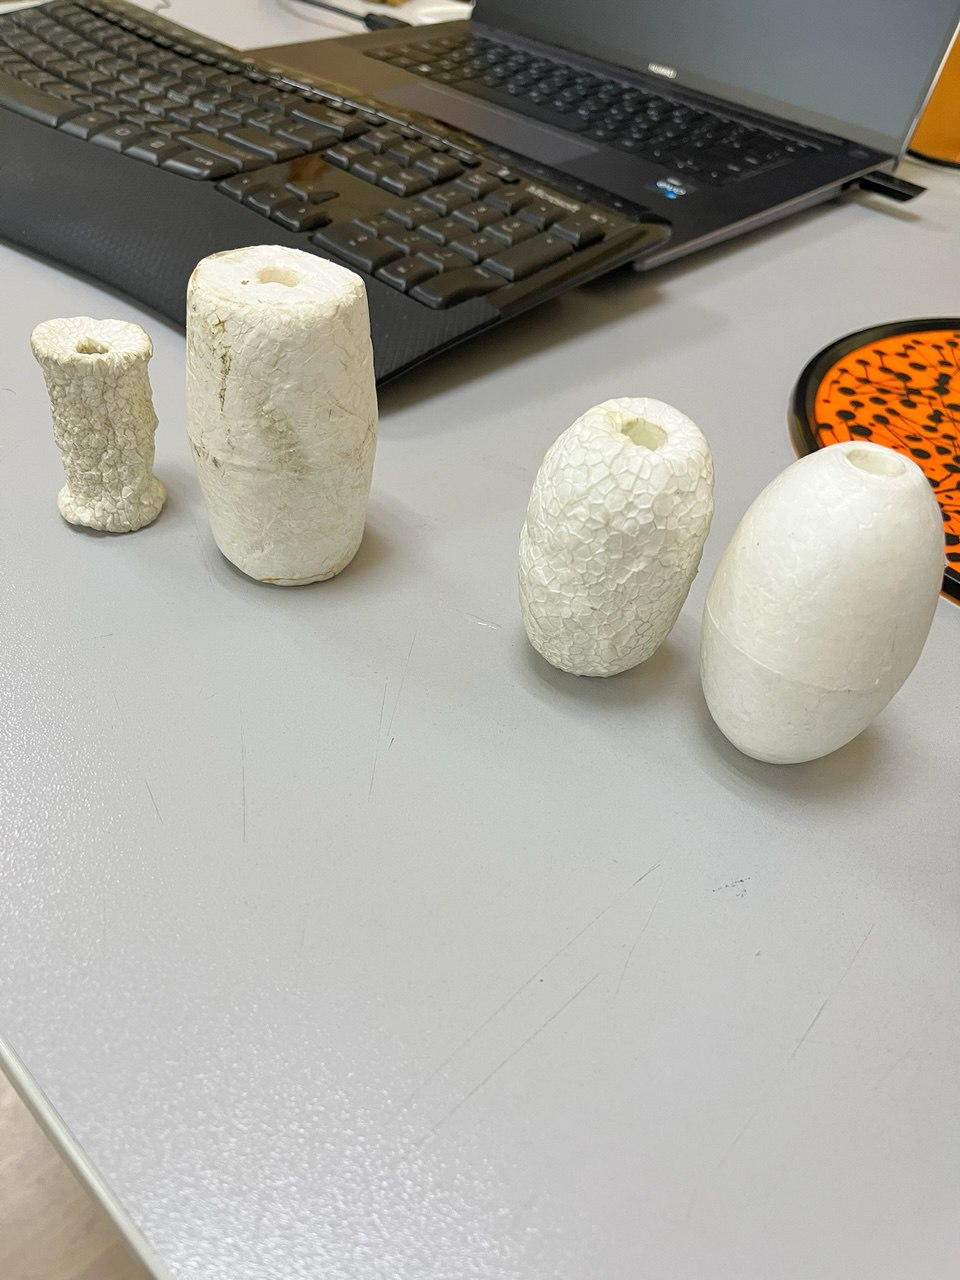
One of the batteries was opened after the experiment (not one of the main five, but an identical specimen). It was electrically fully functional, but...
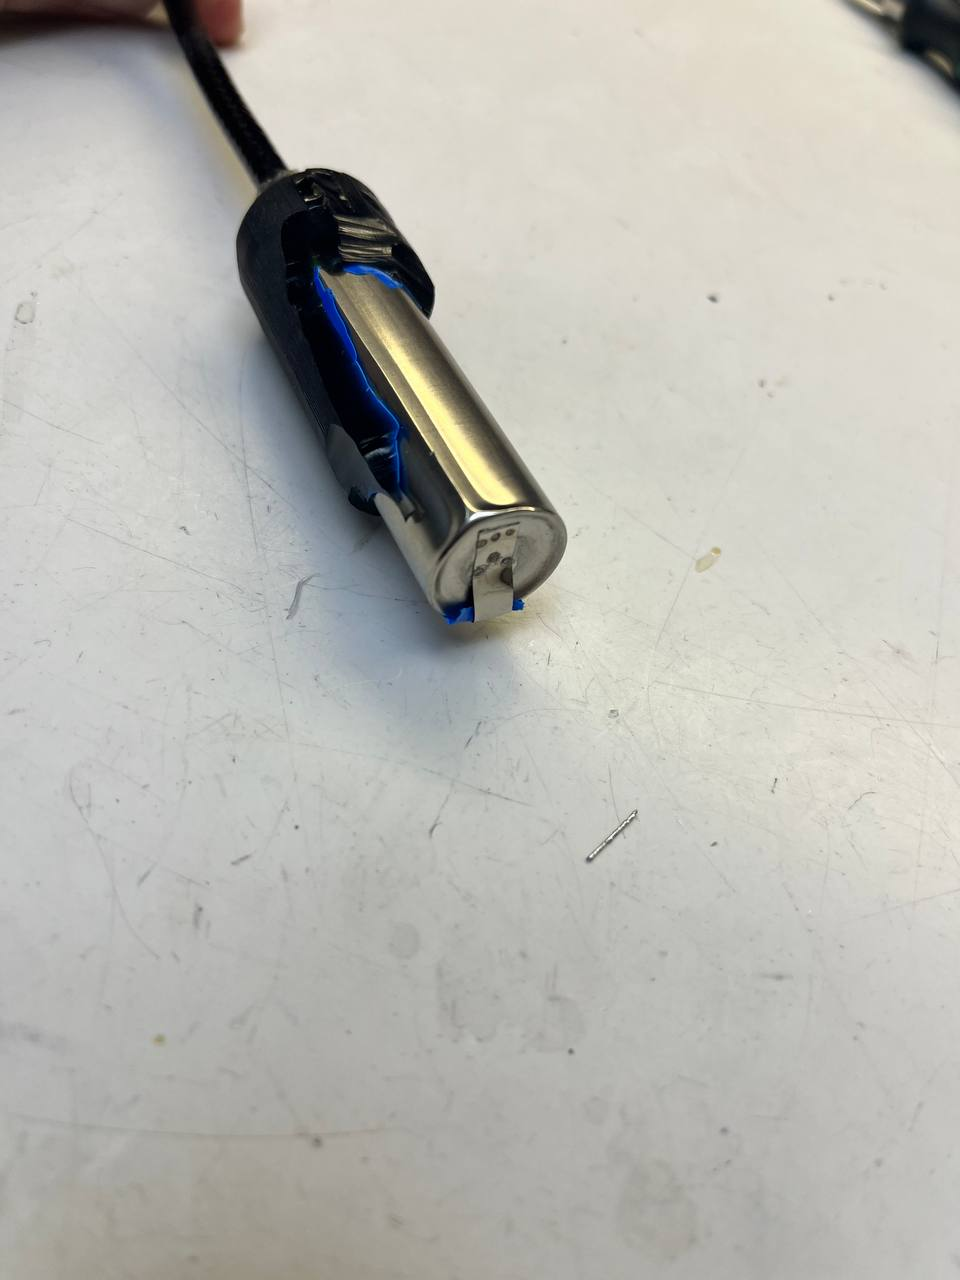
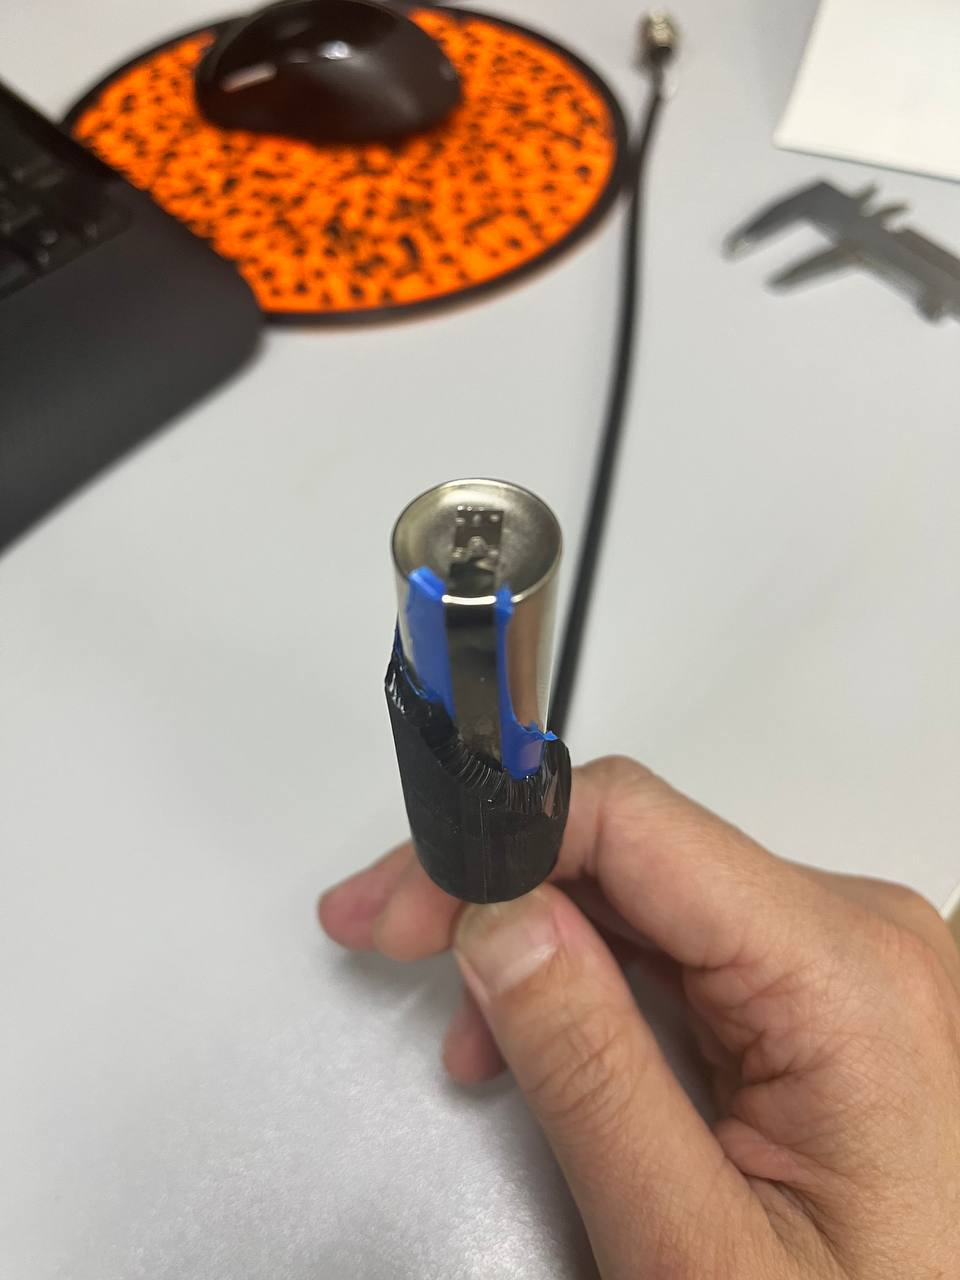
Nothing passes without a trace, especially inelastic deformations. The steel casing showed visible denting and the end cap was pushed inward — yet the cell still worked.
4. Outro
That is all for today. As always, we are sincerely grateful to all readers. Thank you for your time, and we hope this was useful. The full experimental dataset is available on GitHub for anyone who wants to work with the raw data.