How to Properly Sort Content Based on User Ratings
Why simple upvote-minus-downvote and average rating approaches fail, and how the Wilson score confidence interval provides the statistically correct way to rank user-rated content.
Problem Statement
You're developing web applications where users rate content. You want highly-rated content to appear at the top and poorly-rated content at the bottom. You need to calculate a "rating" based on user assessments.
Incorrect Solution #1
Rating = (Number of positive votes) − (Number of negative votes)Why this fails: An item with 600 positive and 400 negative votes (60% positive, rating 200) should rank higher than one with 5500 positive and 4500 negative votes (55% positive, rating 1000). This algorithm reverses the correct order.
Sites making this error: Urban Dictionary
Incorrect Solution #2
Rating = Average rating = (Positive votes) / (Total votes)Why this fails: An item with 2 positive votes and 0 negative votes (100%) ranks above an item with 100 positive votes and 1 negative vote (99%). This penalizes items with more feedback.
Sites making this error: Amazon
The Correct Solution
Rating = Lower bound of the Wilson score confidence interval for a Bernoulli parameterThe mathematical framework, developed by Edwin Wilson in 1927, answers the question: "Given my data, can I say with 95% confidence what the true positive proportion is?"
Formula:
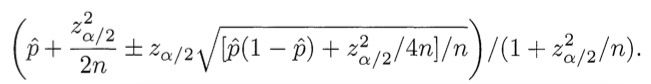
Use the minus sign to compute the lower bound. Here p̂ is the observed positive proportion, zα/2 is the (1−α/2) quantile of the standard normal distribution, and n is the total number of votes.
Ruby Implementation
require 'statistics2'

def ci_lower_bound(pos, n, confidence)
    if n == 0
        return 0
    end
    z = Statistics2.pnormaldist(1-(1-confidence)/2)
    phat = 1.0*pos/n
    (phat + z*z/(2*n) - z * Math.sqrt((phat*(1-phat)+z*z/(4*n))/n))/(1+z*z/n)
end
Parameters: pos = number of positive votes, n = total number of votes, confidence = confidence level (use 0.95 for 95% confidence). Use z = 1.96 for 95% confidence if you don't have a statistical library.
SQL Query
SELECT
    widget_id,
    ((positive + 1.9208) / (positive + negative) -
        1.96 * SQRT((positive * negative) / (positive + negative) + 0.9604) /
        (positive + negative)) / (1 + 3.8416 / (positive + negative))
    AS ci_lower_bound
FROM widgets WHERE positive + negative > 0
ORDER BY ci_lower_bound DESC;
Alternative Applications
The Wilson confidence interval applies wherever you want to "confidently determine the proportion of people performing a specific action":
- Spam/abuse detection: What proportion of viewers flagged this as spam?
- "Best of" lists: What proportion of users marked this as "best"?
- "Most shared" lists: What proportion of users clicked share?
This method works much better than simple positive-to-total ratios for "best of" lists relative to views, downloads, or purchases, since user inaction itself contains information about quality.
References
- Binomial proportion confidence interval (Wikipedia)
- Agresti, Alan and Brent A. Coull (1998), "Approximate is Better than 'Exact' for Interval Estimation of Binomial Proportions," The American Statistician, 52, 119-126
- Wilson, E. B. (1927), "Probable Inference, the Law of Succession, and Statistical Inference," Journal of the American Statistical Association, 22, 209-212
JavaScript Implementation
function wilson_score(up, down) {
    if (!up) return -down;
    var n = up + down;
    var z = 1.64485; //1.0 = 85%, 1.6 = 95%
    var phat = up / n;
    return (phat+z*z/(2*n)-z*Math.sqrt((phat*(1-phat)+z*z/(4*n))/n))/(1+z*z/n);
}
Python Implementation (Arbitrary Scale)
def wilson_score(sum_rating, n, votes_range = [0, 1]):
    z = 1.64485
    v_min = min(votes_range)
    v_width = float(max(votes_range) - v_min)
    phat = (sum_rating - n * v_min) / v_width / float(n)
    rating = (phat+z*z/(2*n)-z*sqrt((phat*(1-phat)+z*z/(4*n))/n))/(1+z*z/n)
    return rating * v_width + v_min
Parameters: sum_rating = total sum of all votes, n = number of votes, votes_range = the possible rating range (e.g. [0, 1] for binary, [1, 5] for a 5-star system). Returns a value within the specified range.