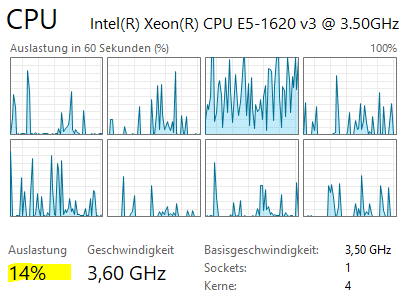
Don't Look at CPU Usage % with Hyper-Threading
CPU usage percentage is a misleading metric when hyper-threading is involved. Through controlled assembly-level benchmarks, this article demonstrates why Instructions Per Cycle (IPC) is the proper way to measure processor utilization.
We all know that doubling the number of cores through hyper-threading doesn't generally double performance. But why exactly, and what should we look at instead? This article dives deep into processor microarchitecture with controlled assembly-language experiments to show why the CPU usage percentage in your task manager is essentially lying to you.
Test Environment
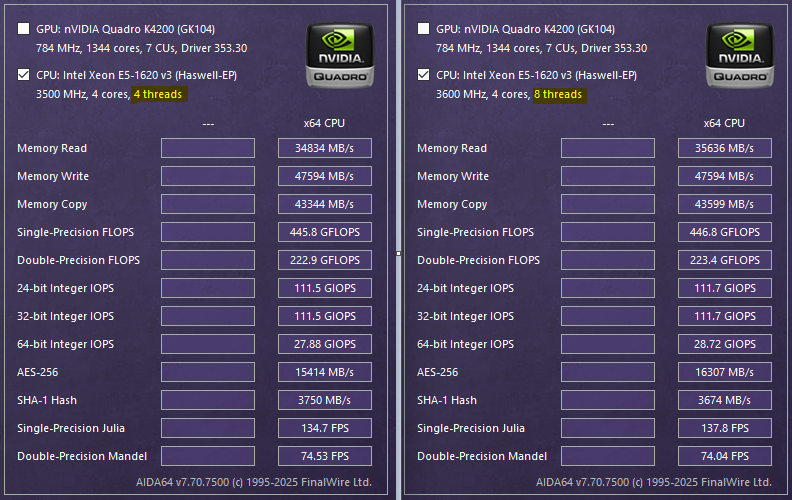
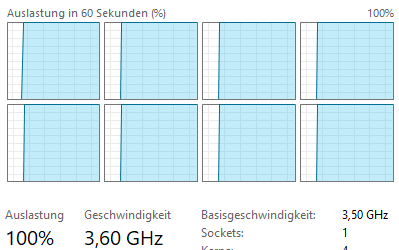
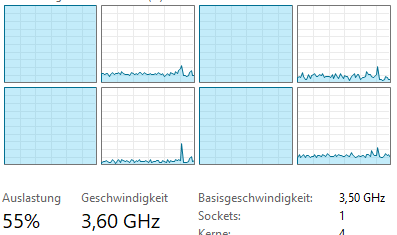
All experiments were conducted on a Xeon processor with 4 physical cores and hyper-threading enabled (8 logical cores). The base clock is 3.5 GHz with turbo boost up to 3.6 GHz.

Synthetic Multiplication Test
The core test uses Euro Assembler to perform 1.2 billion multiplication operations:
mov r8, 1_200_000_000
.loop:
    imul r10, r10
    dec r8
    jnz .loop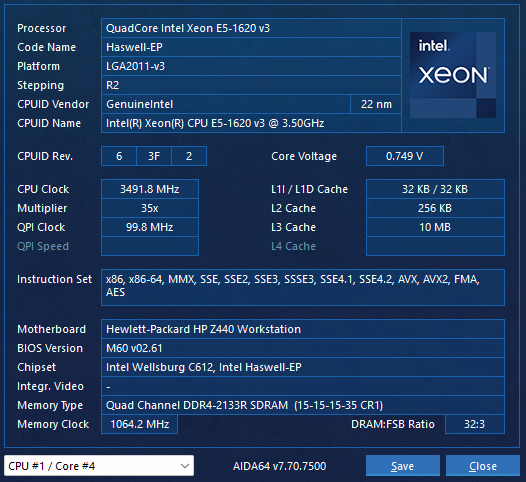
Results:
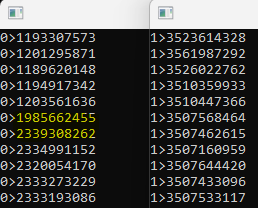
- One copy on a single core: ~3.5 billion ticks (1 second)
- Four copies on four physical cores: each runs independently with no degradation
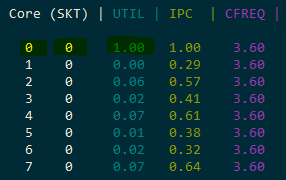
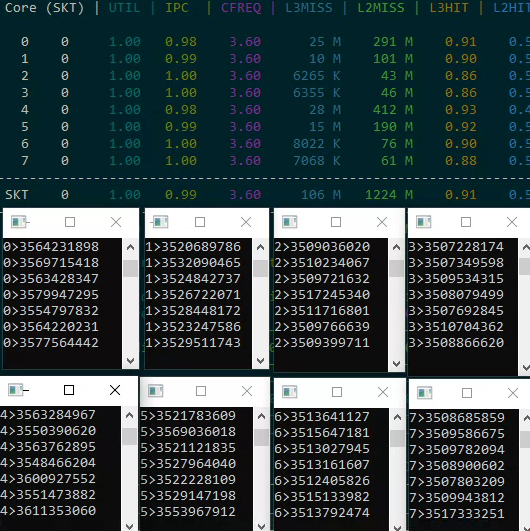
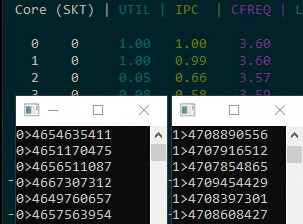
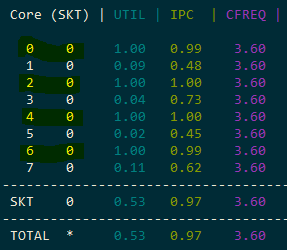
- Eight copies on eight logical cores: performance does not degrade, IPC stays at ~1.0
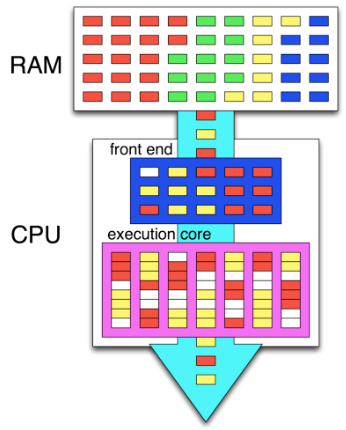
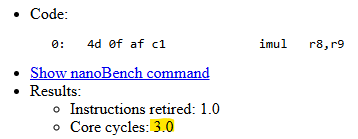
Why Does This Work? Pipeline Utilization
The key insight is understanding pipeline utilization. The imul instruction has a latency of 3 clock cycles. In our loop, there are effectively 3 instructions (multiplication, decrement, and conditional jump — though dec and jnz are fused into one micro-op via macro-fusion). This means the pipeline is only ~33% utilized during multiplication.
Hyper-threading allows a second logical thread to fill the remaining ~67% of the pipeline that would otherwise sit idle. This is why running two threads on the same physical core doesn't degrade either thread's performance in this particular case.
Impact of Instruction Count
Testing with 2-4 multiplications per loop iteration reveals the saturation point:
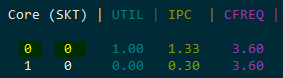
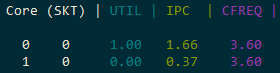
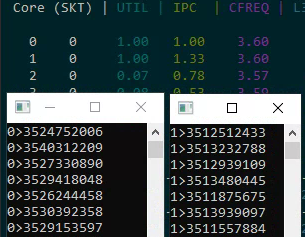
- 2 multiplications: IPC = 1.33 (4 instructions / 3 cycles)
- 3 multiplications: IPC = 1.66 (5 instructions / 3 cycles)
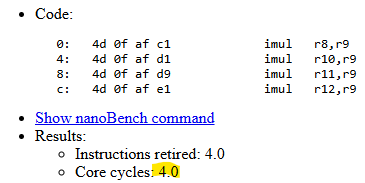
- 4 multiplications: 4.6-4.7 billion ticks — the pipeline is fully saturated
When the pipeline is fully loaded, hyper-threading provides no benefit — in fact, the second thread actively competes for resources and slows down the first.
Real-World Test: SHA-256
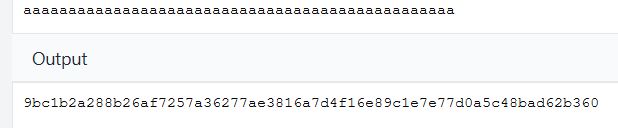
Moving from synthetic benchmarks to a real cryptographic function implemented in pure assembly:
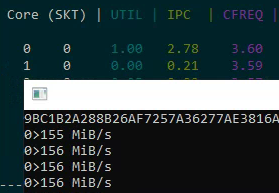
- Single core: 155-156 MB/s, IPC = 2.78
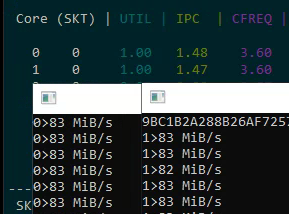
- Two logical cores on one physical core: 83 MB/s each (166 MB/s total — only a ~10% gain from hyper-threading)
The practical gain from hyper-threading in a real-world, compute-intensive task is just a few percent. The SHA-256 algorithm already keeps the pipeline busy with an IPC of 2.78, leaving little room for a second thread.
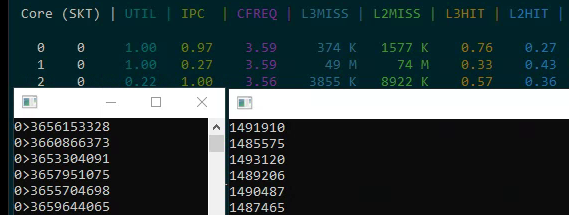
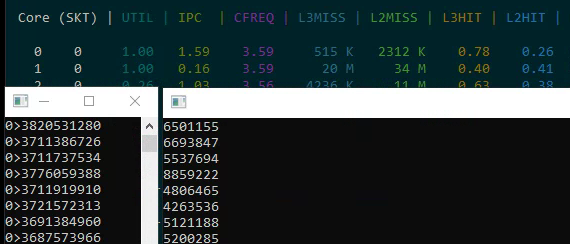
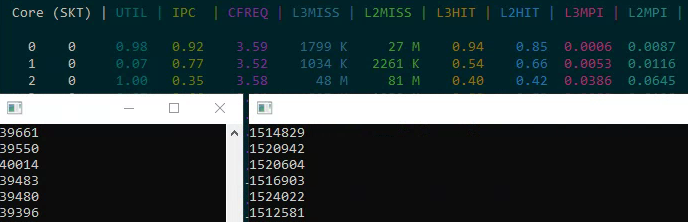
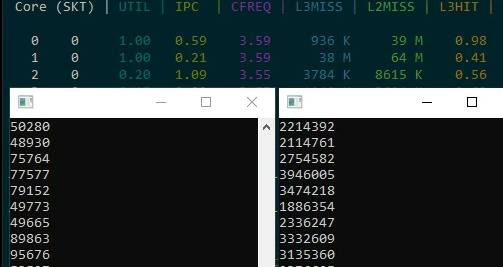
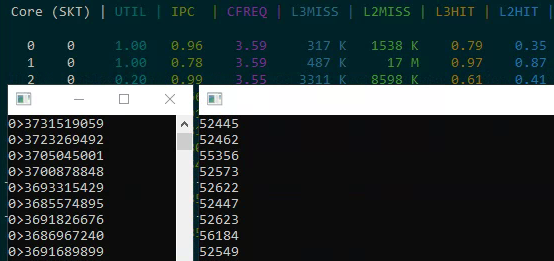
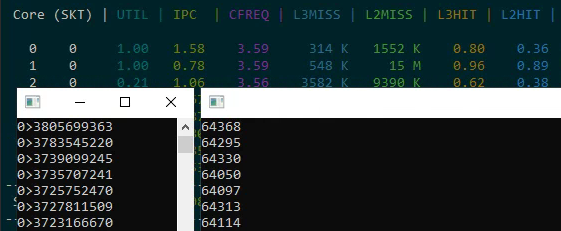
Cache Effects
Two memory access tests reveal cache contention problems:
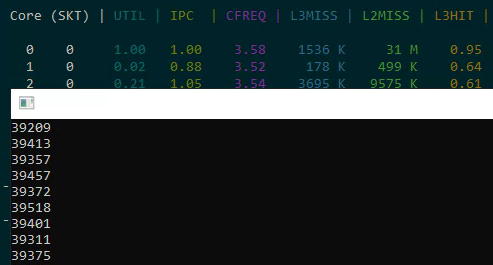
- Sequential read of 32K: ~40 thousand increments (good cache behavior)
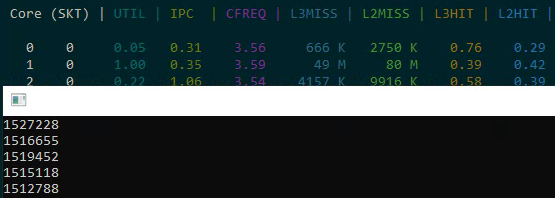
- Strided read of 32K from a 1GB array: significantly slower due to cache misses
When both tests run simultaneously on the same physical core, both slow down significantly because they share the L3 cache. Threads accessing different memory regions on the same physical core create cache contention that degrades both threads' performance.
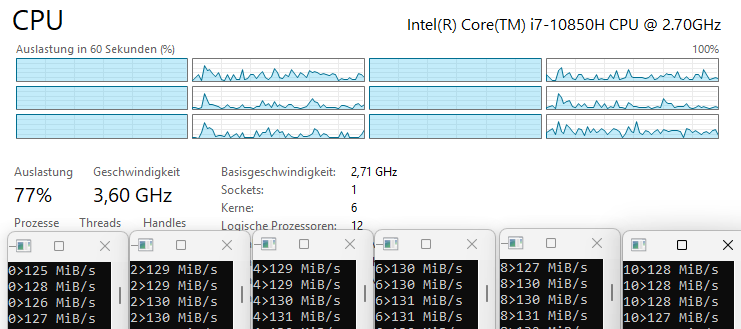
Turbo Boost Effects
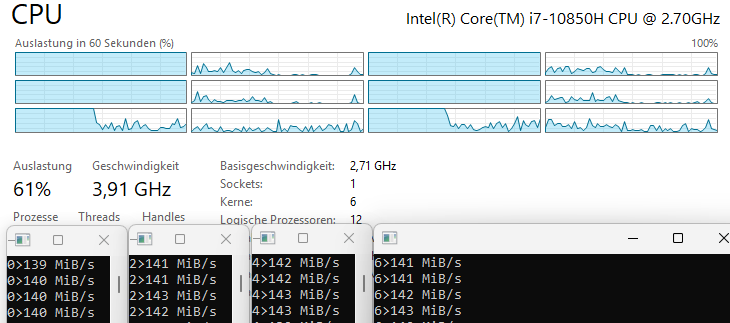
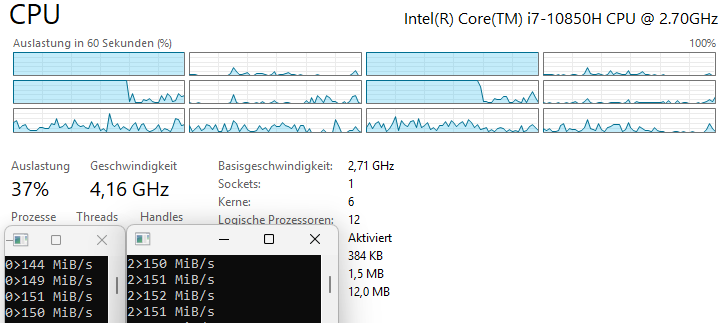
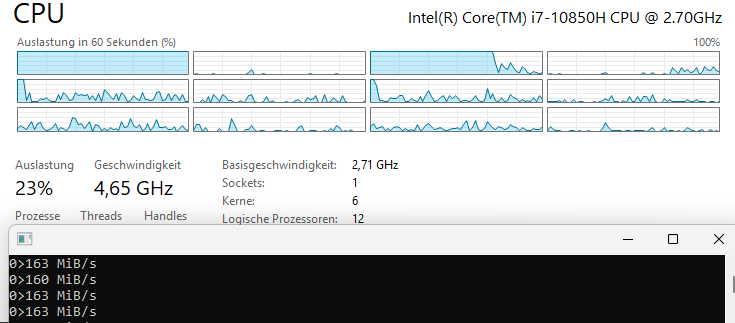
On a 6-core processor, turbo boost frequency decreases as more cores become active:
- 1 thread: 160 MB/s (maximum turbo)
- 2 threads: 145 MB/s
- 4 threads: 138 MB/s
- 6 threads: 130 MB/s
The clock frequency drops by several hundred MHz as load increases across cores. This means that even without hyper-threading, adding more threads doesn't scale linearly because each thread runs at a lower frequency.
Latency vs. Throughput
Understanding the distinction between latency and throughput is critical:
- The
imulinstruction has a latency of 3 cycles but can be issued every cycle if there are no data dependencies - The processor uses macro-fusion to combine
dec+jnzinto a single micro-op
Measurement Methodology
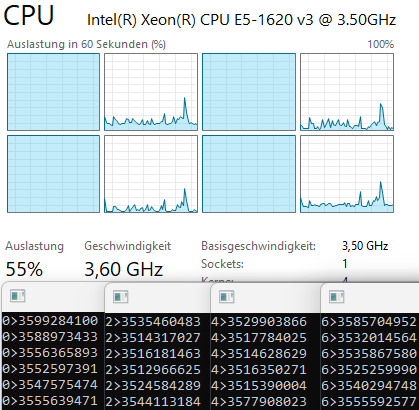
All timing uses RDTSC (Time Stamp Counter) at the base frequency of 3.5 GHz. RDTSCP additionally returns the core number in ECX, which helps verify thread affinity.
Power Consumption
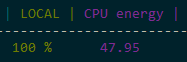
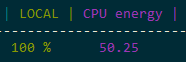
Power consumption is not a reliable corrective metric either. Energy usage barely changes when adding hyper-threaded load to a core — the transistors are switching regardless. This means you can't use power draw as a proxy for "real" utilization.
Critical Conclusions
- CPU usage percentage does not reflect actual utilization. At 50% load, pipelines may only be 33% filled.
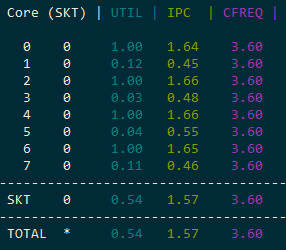
- The correct metric is IPC (Instructions Per Cycle). You can measure this using Intel Performance Counter Monitor.
- Hyper-threading only helps when pipelines are underutilized. If pipelines are fully loaded, the second logical thread slows down the first.
- Power draw is not a good corrective metric. Energy consumption barely changes when adding hyper-threaded load.
- In real applications, the gain is typically 5-10%, not the doubling of performance that the doubled core count might suggest.
Practical Recommendations
- Distribute threads that read different memory regions across different physical cores
- Evaluate real utilization through IPC, not percentages in Task Manager
- Account for turbo boost reduction under full load across all cores
- Remember that hyper-threading is a compromise for underutilized pipelines
Additional Resources
- uops.info — reference for instruction latency and throughput
- Intel Performance Counter Monitor — for IPC analysis
- Source code on GitHub