Coronavirus: Why You Must Act Now
With everything happening with the coronavirus, it can be very difficult to decide what to do right now. Should you wait for more information? Should you do something today? If so, what?
Introduction
With everything happening with the coronavirus, it can be very difficult to decide what to do right now. Should you wait for more information? Should you do something today? If so, what?
In this article, with numerous charts, data, and models from many sources, we will try to answer the following questions:
- How many people will get coronavirus in your area?
- What will happen when they start getting sick?
- What should you do?
- When?
When you finish reading this article, you will come to the following conclusions:
- Coronavirus is coming to you.
- It's coming at exponential speed: gradually at first, then suddenly.
- It's a matter of days. Maybe a week or two.
- When it arrives, your healthcare system will be overwhelmed.
- Your fellow citizens will be treated in hallways.
- Exhausted healthcare workers will break down. Some will die.
- They will have to decide which patients receive treatment and which ones die.
- The only way to prevent this is social distancing today. Not tomorrow. Today.
- That means keeping as many people home as possible, starting now.
If you are a politician, community leader, or business executive, you have the power and responsibility to prevent what is described above.
Right now you might be afraid: what if this is an overreaction? Won't people laugh at me? Will they get angry at me? Won't I look foolish? Isn't it better to wait until others take the first step? What if it hurts business too much?
However, in 2-4 weeks, when the entire world is locked down and isolated, when it turns out that the few precious days of social distancing you organized saved lives, nobody will criticize you anymore. People will thank you for making the right decision.
So let's dig in.
1. How Many Coronavirus Cases Will There Be in Your Area?
Growth by Country
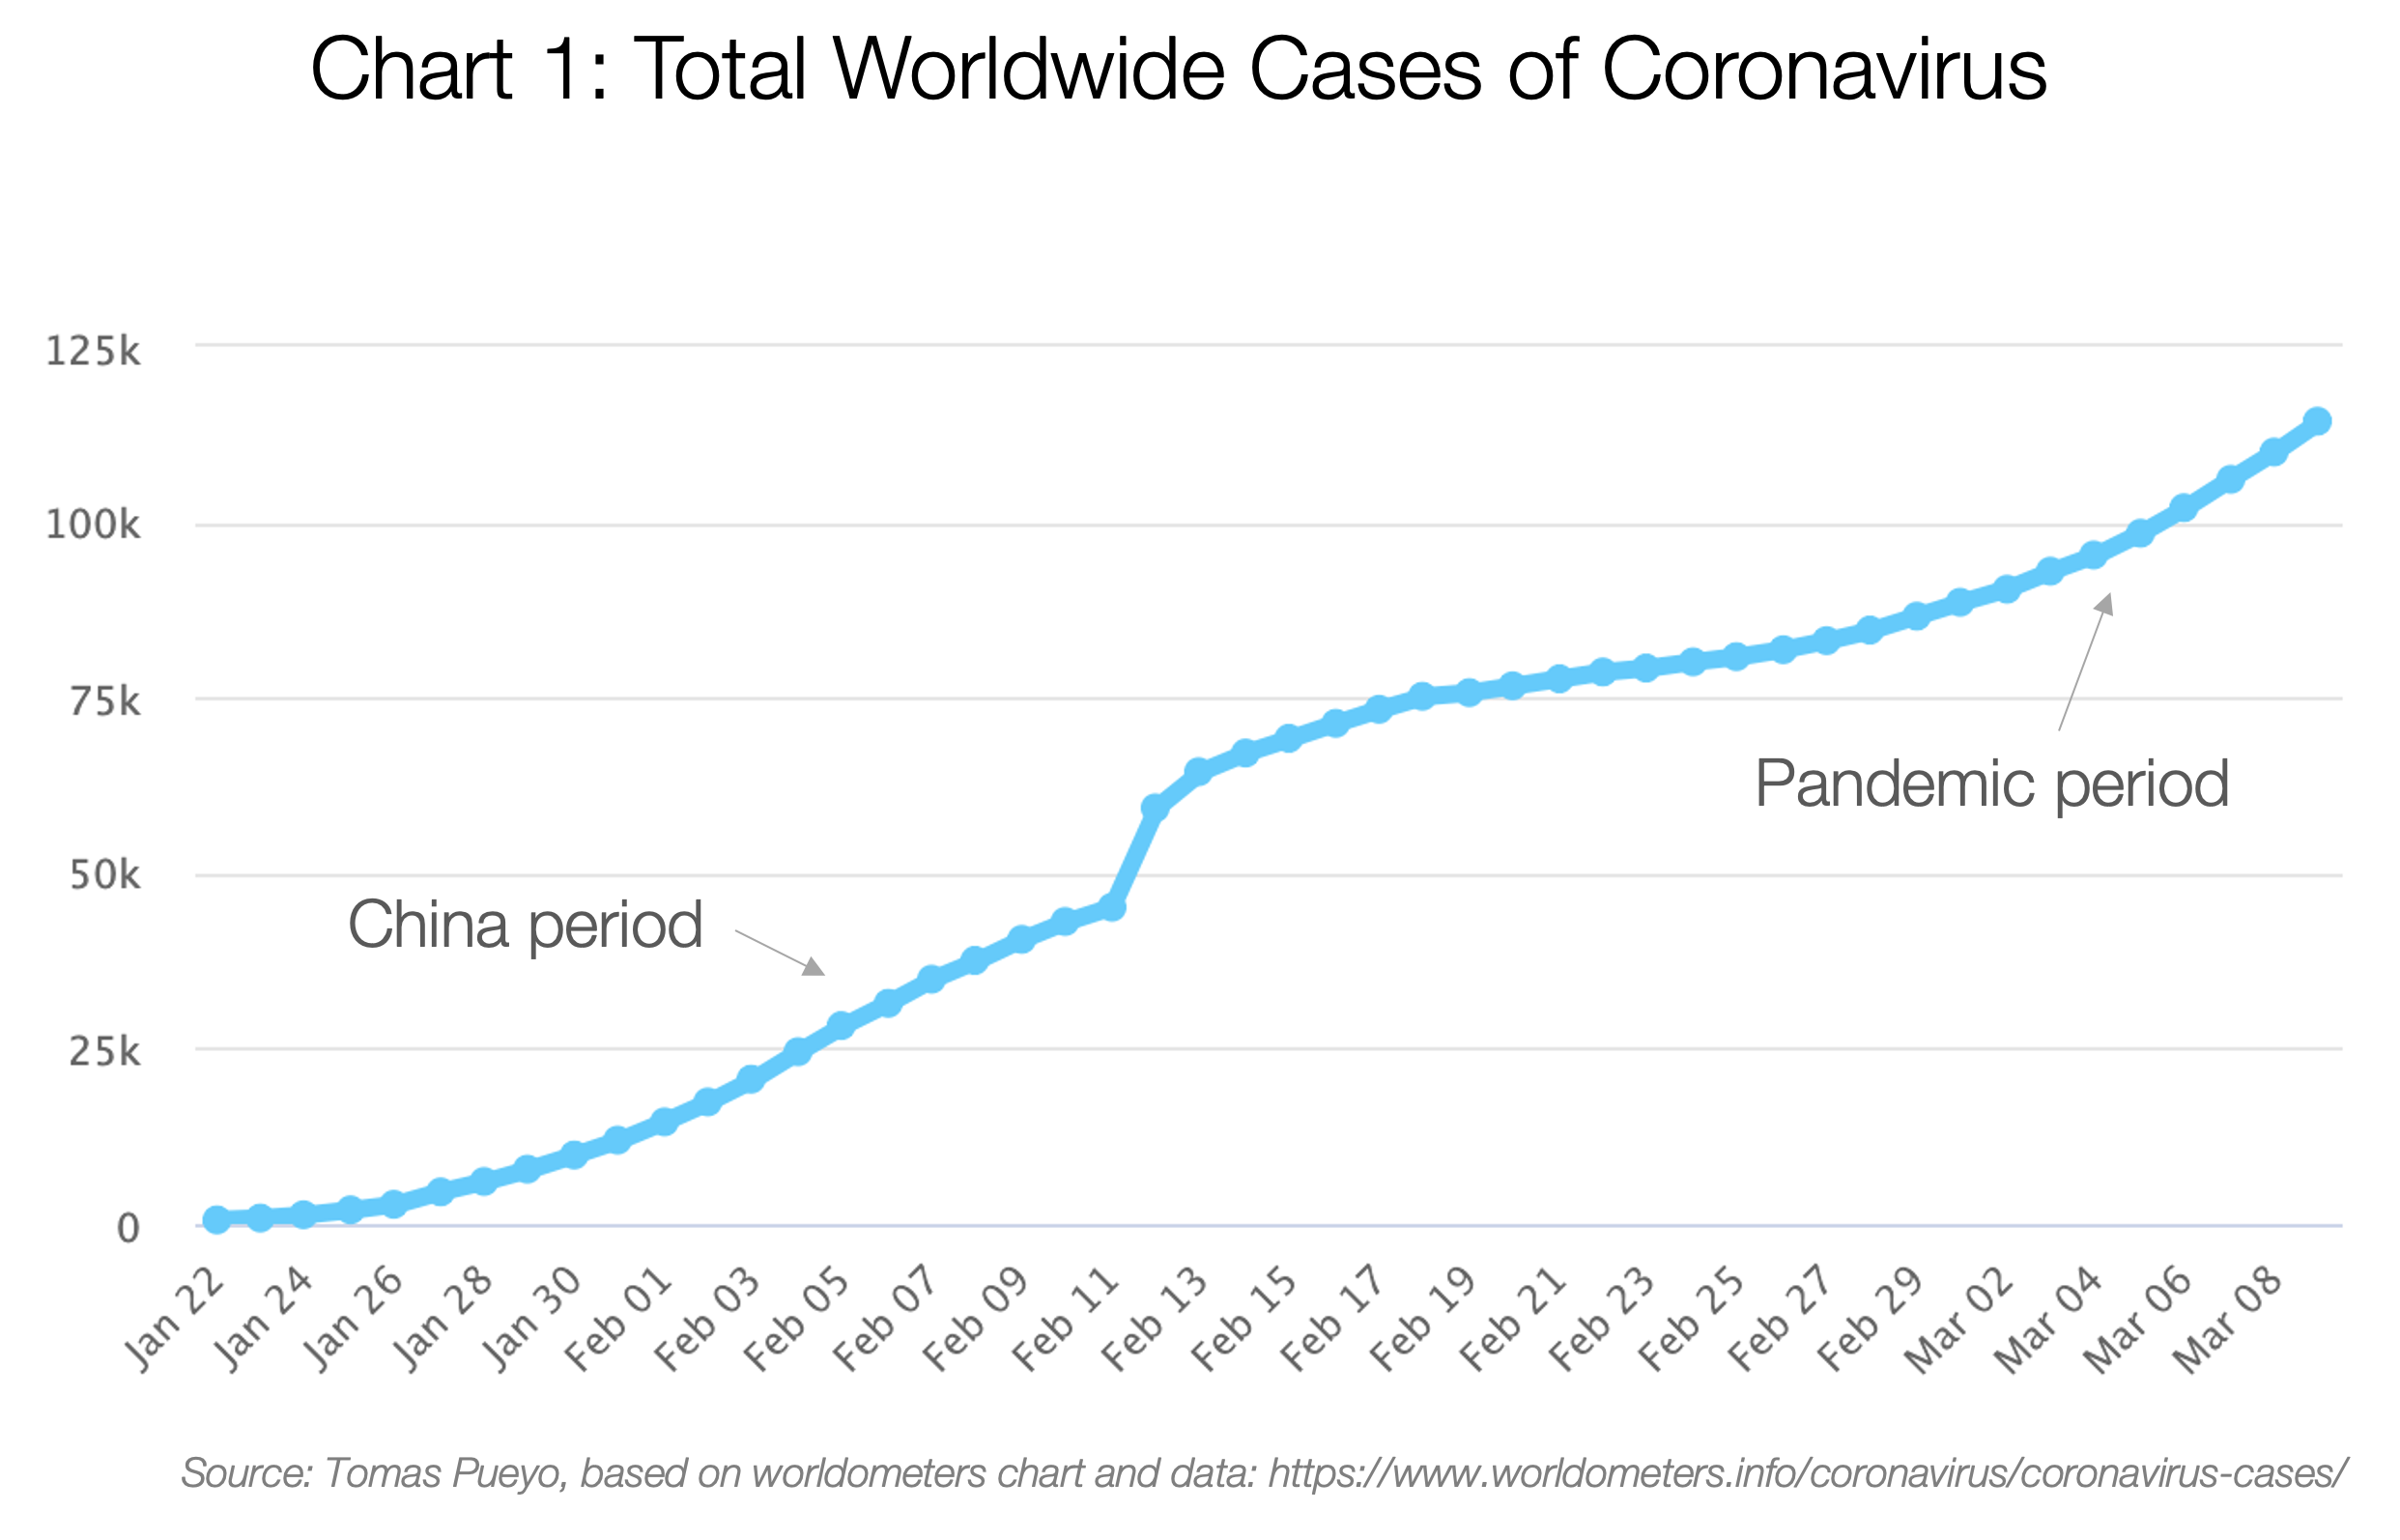
The total number of cases was growing exponentially until China stopped it. But then the coronavirus leaked out, and now it's a pandemic that nobody can stop.
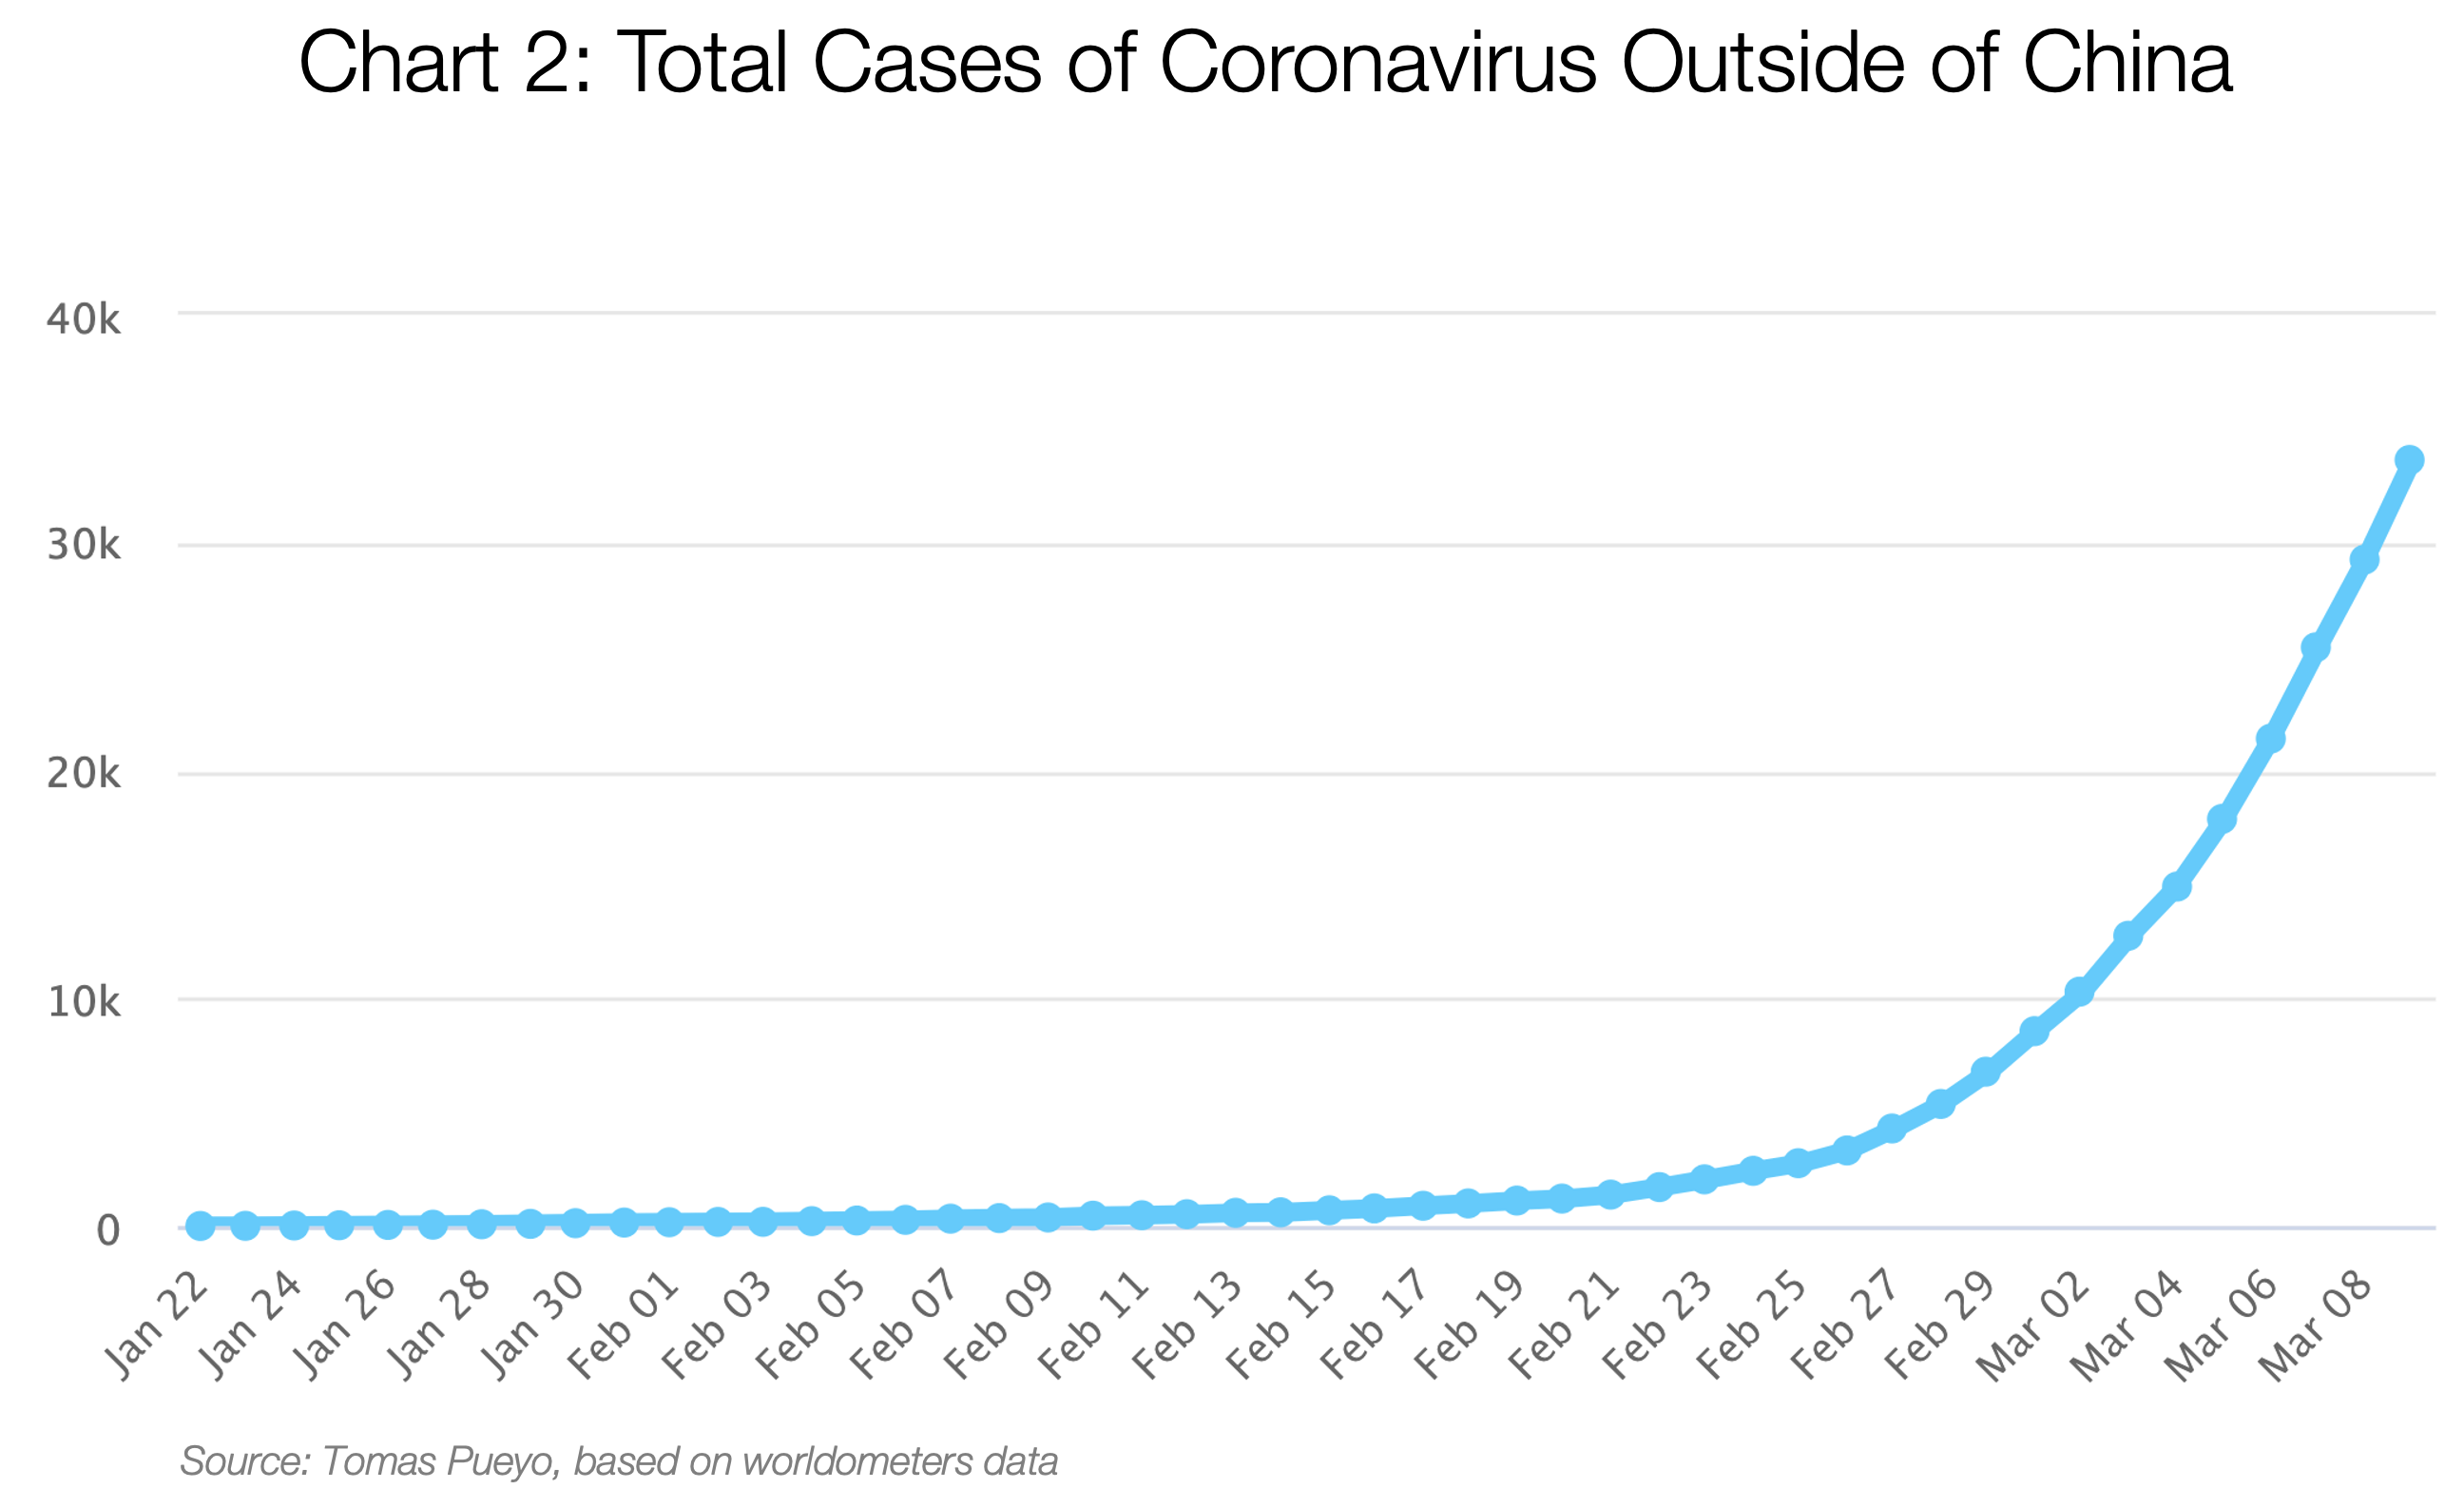
As of today, the main contributors are Italy, Iran, and South Korea:
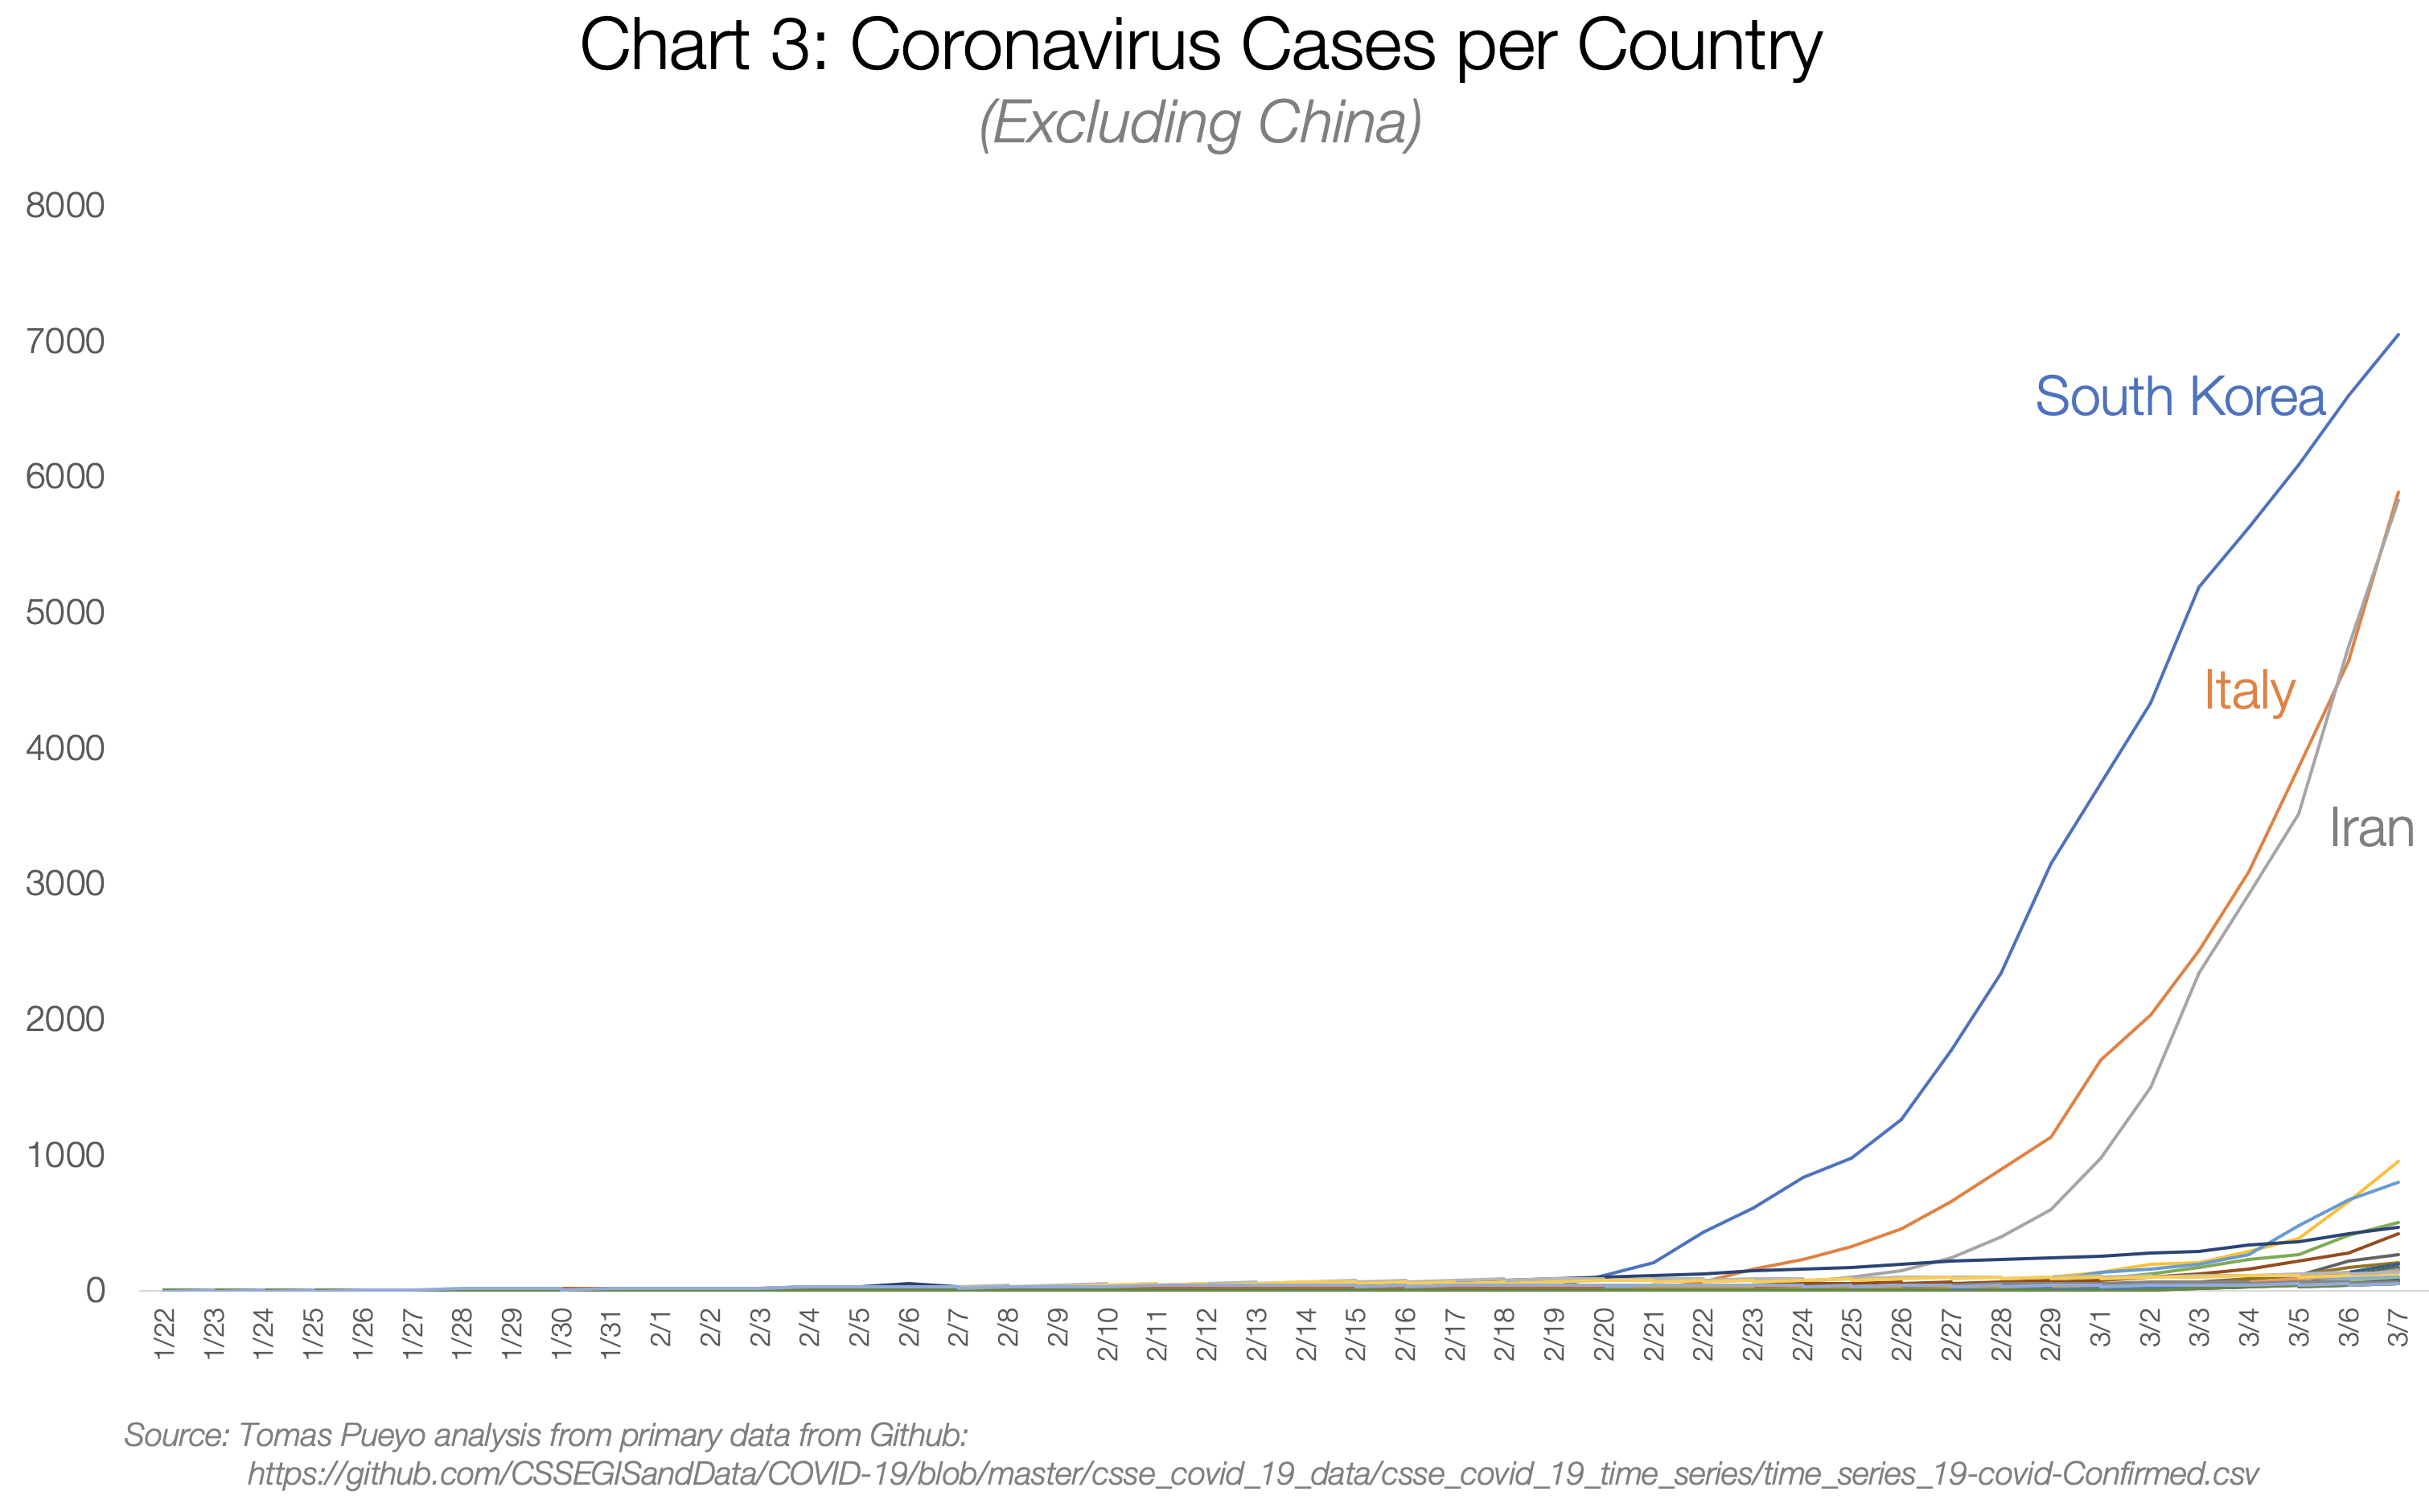
South Korea, Italy, and China have so many cases that it's hard to see the other countries, but let's zoom in on the bottom right corner.
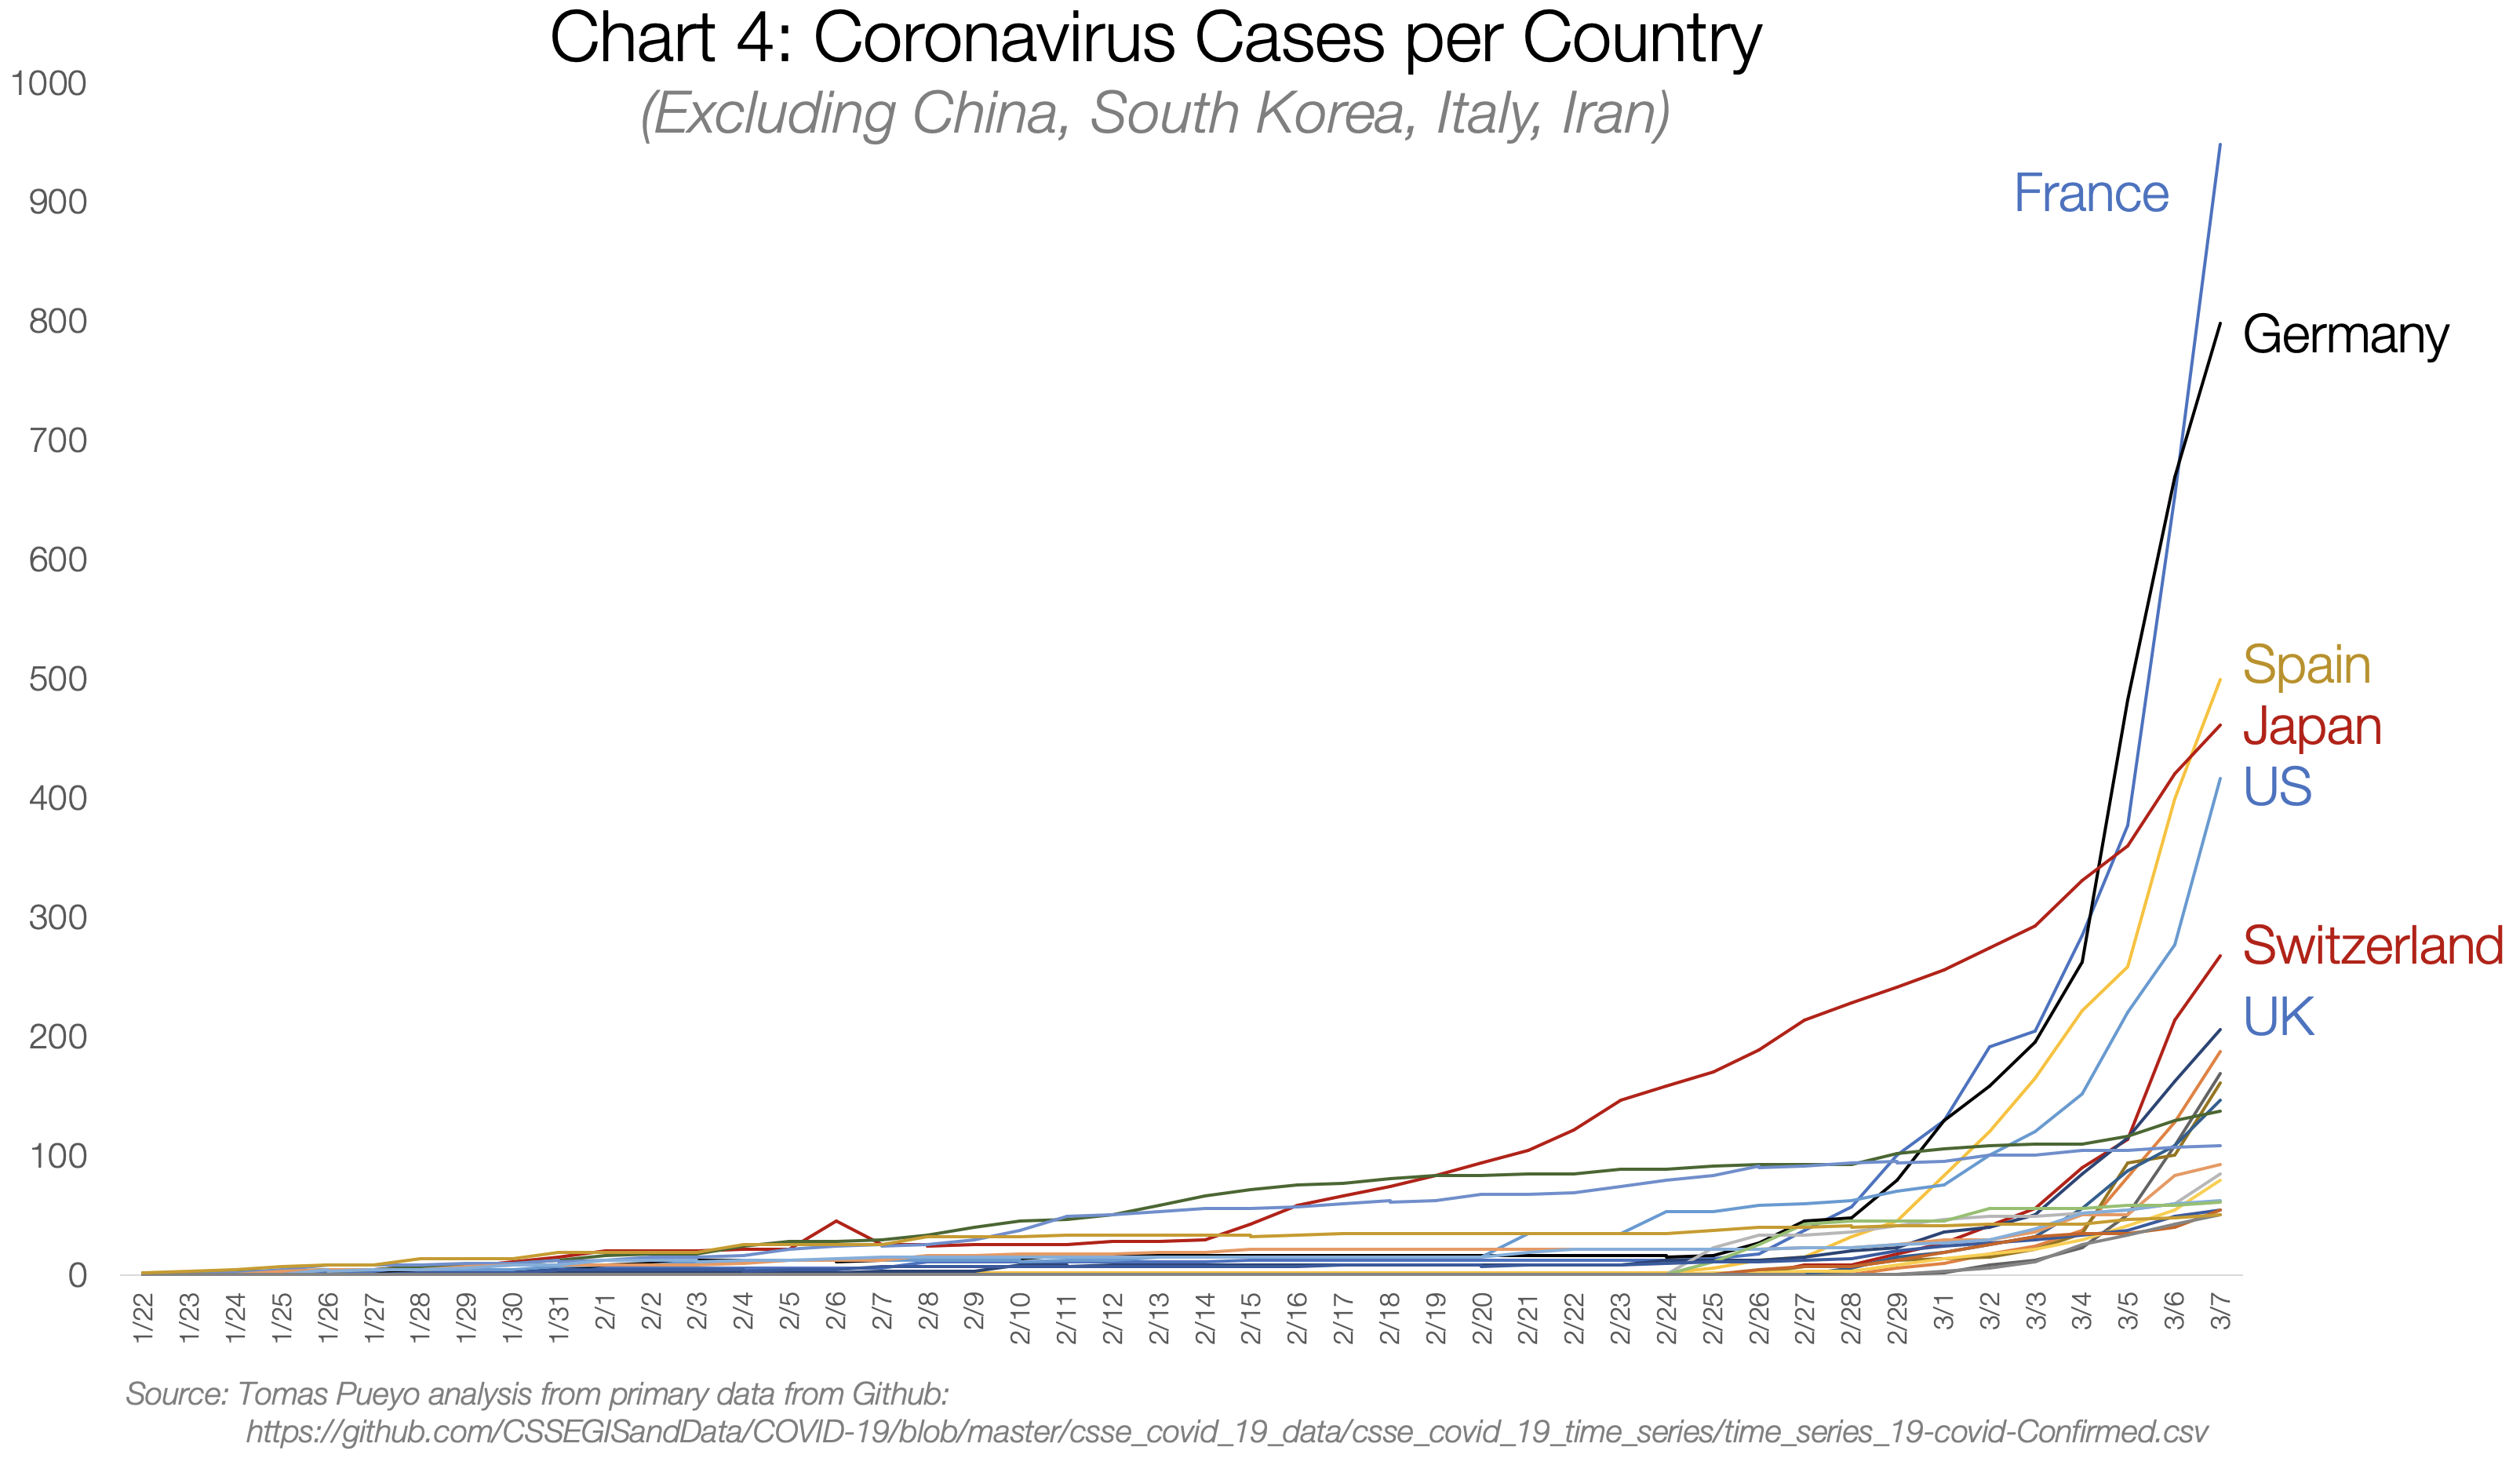
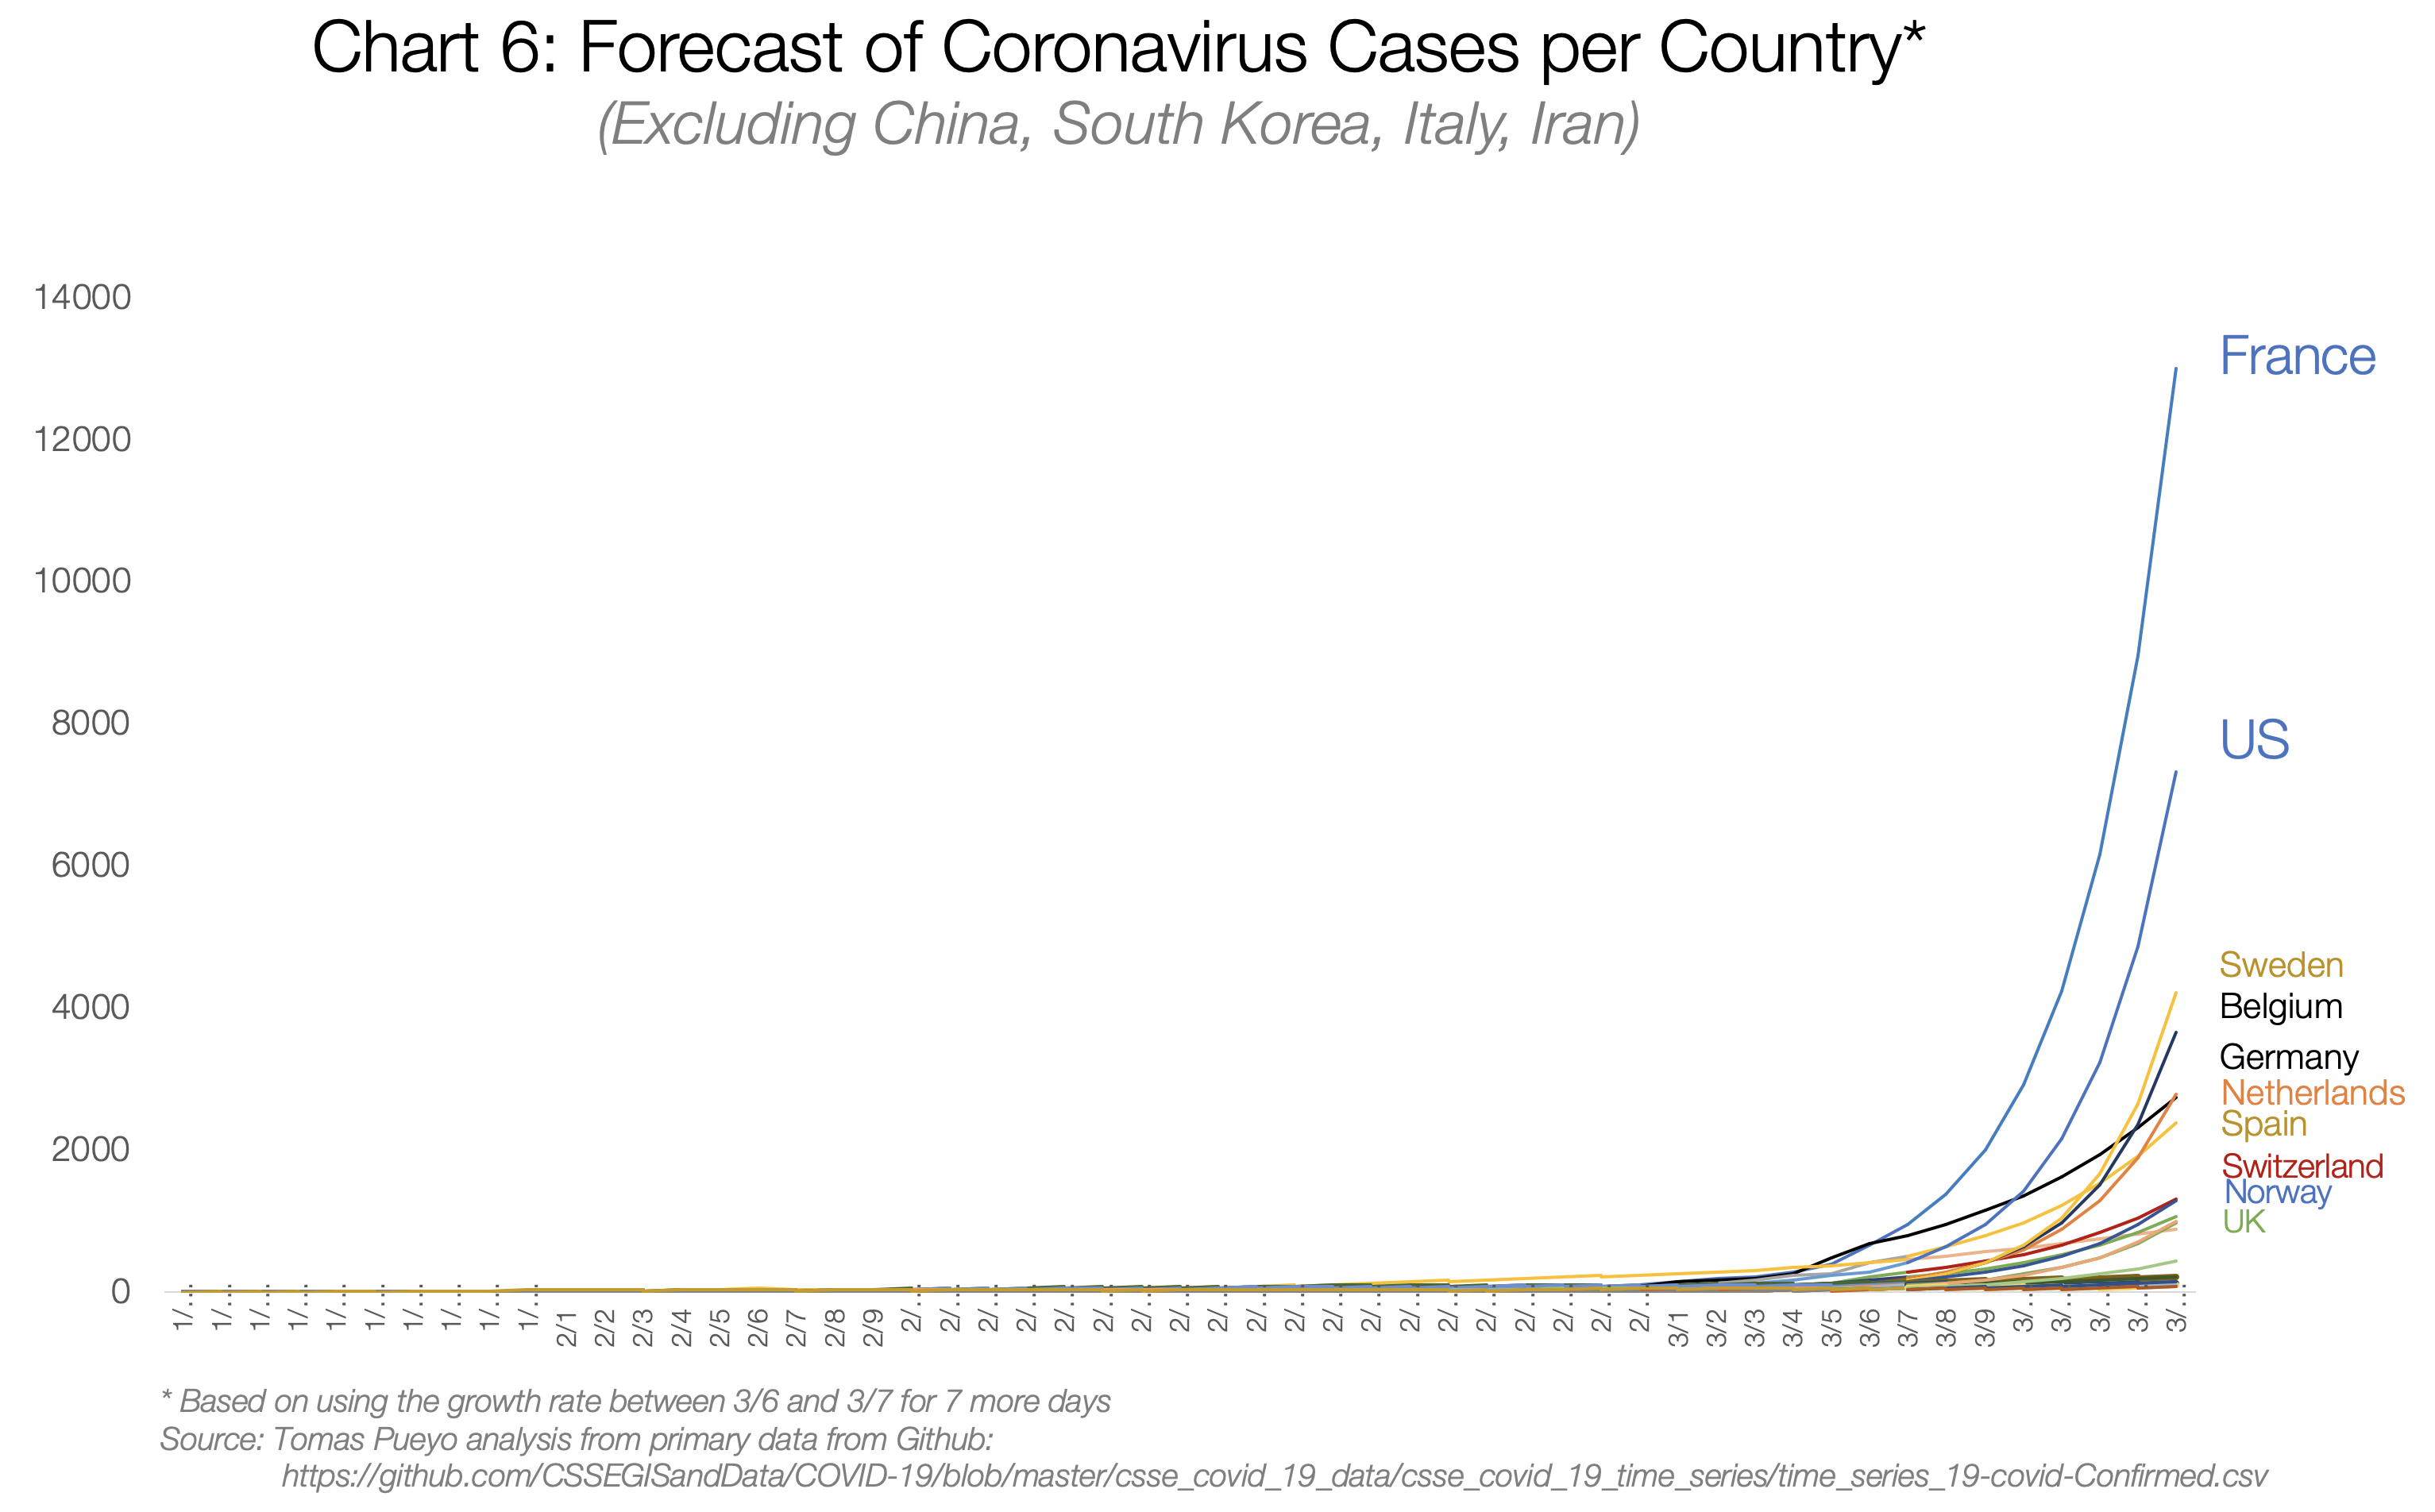
There are dozens of countries with exponential growth rates. As of today, most of them are Western.
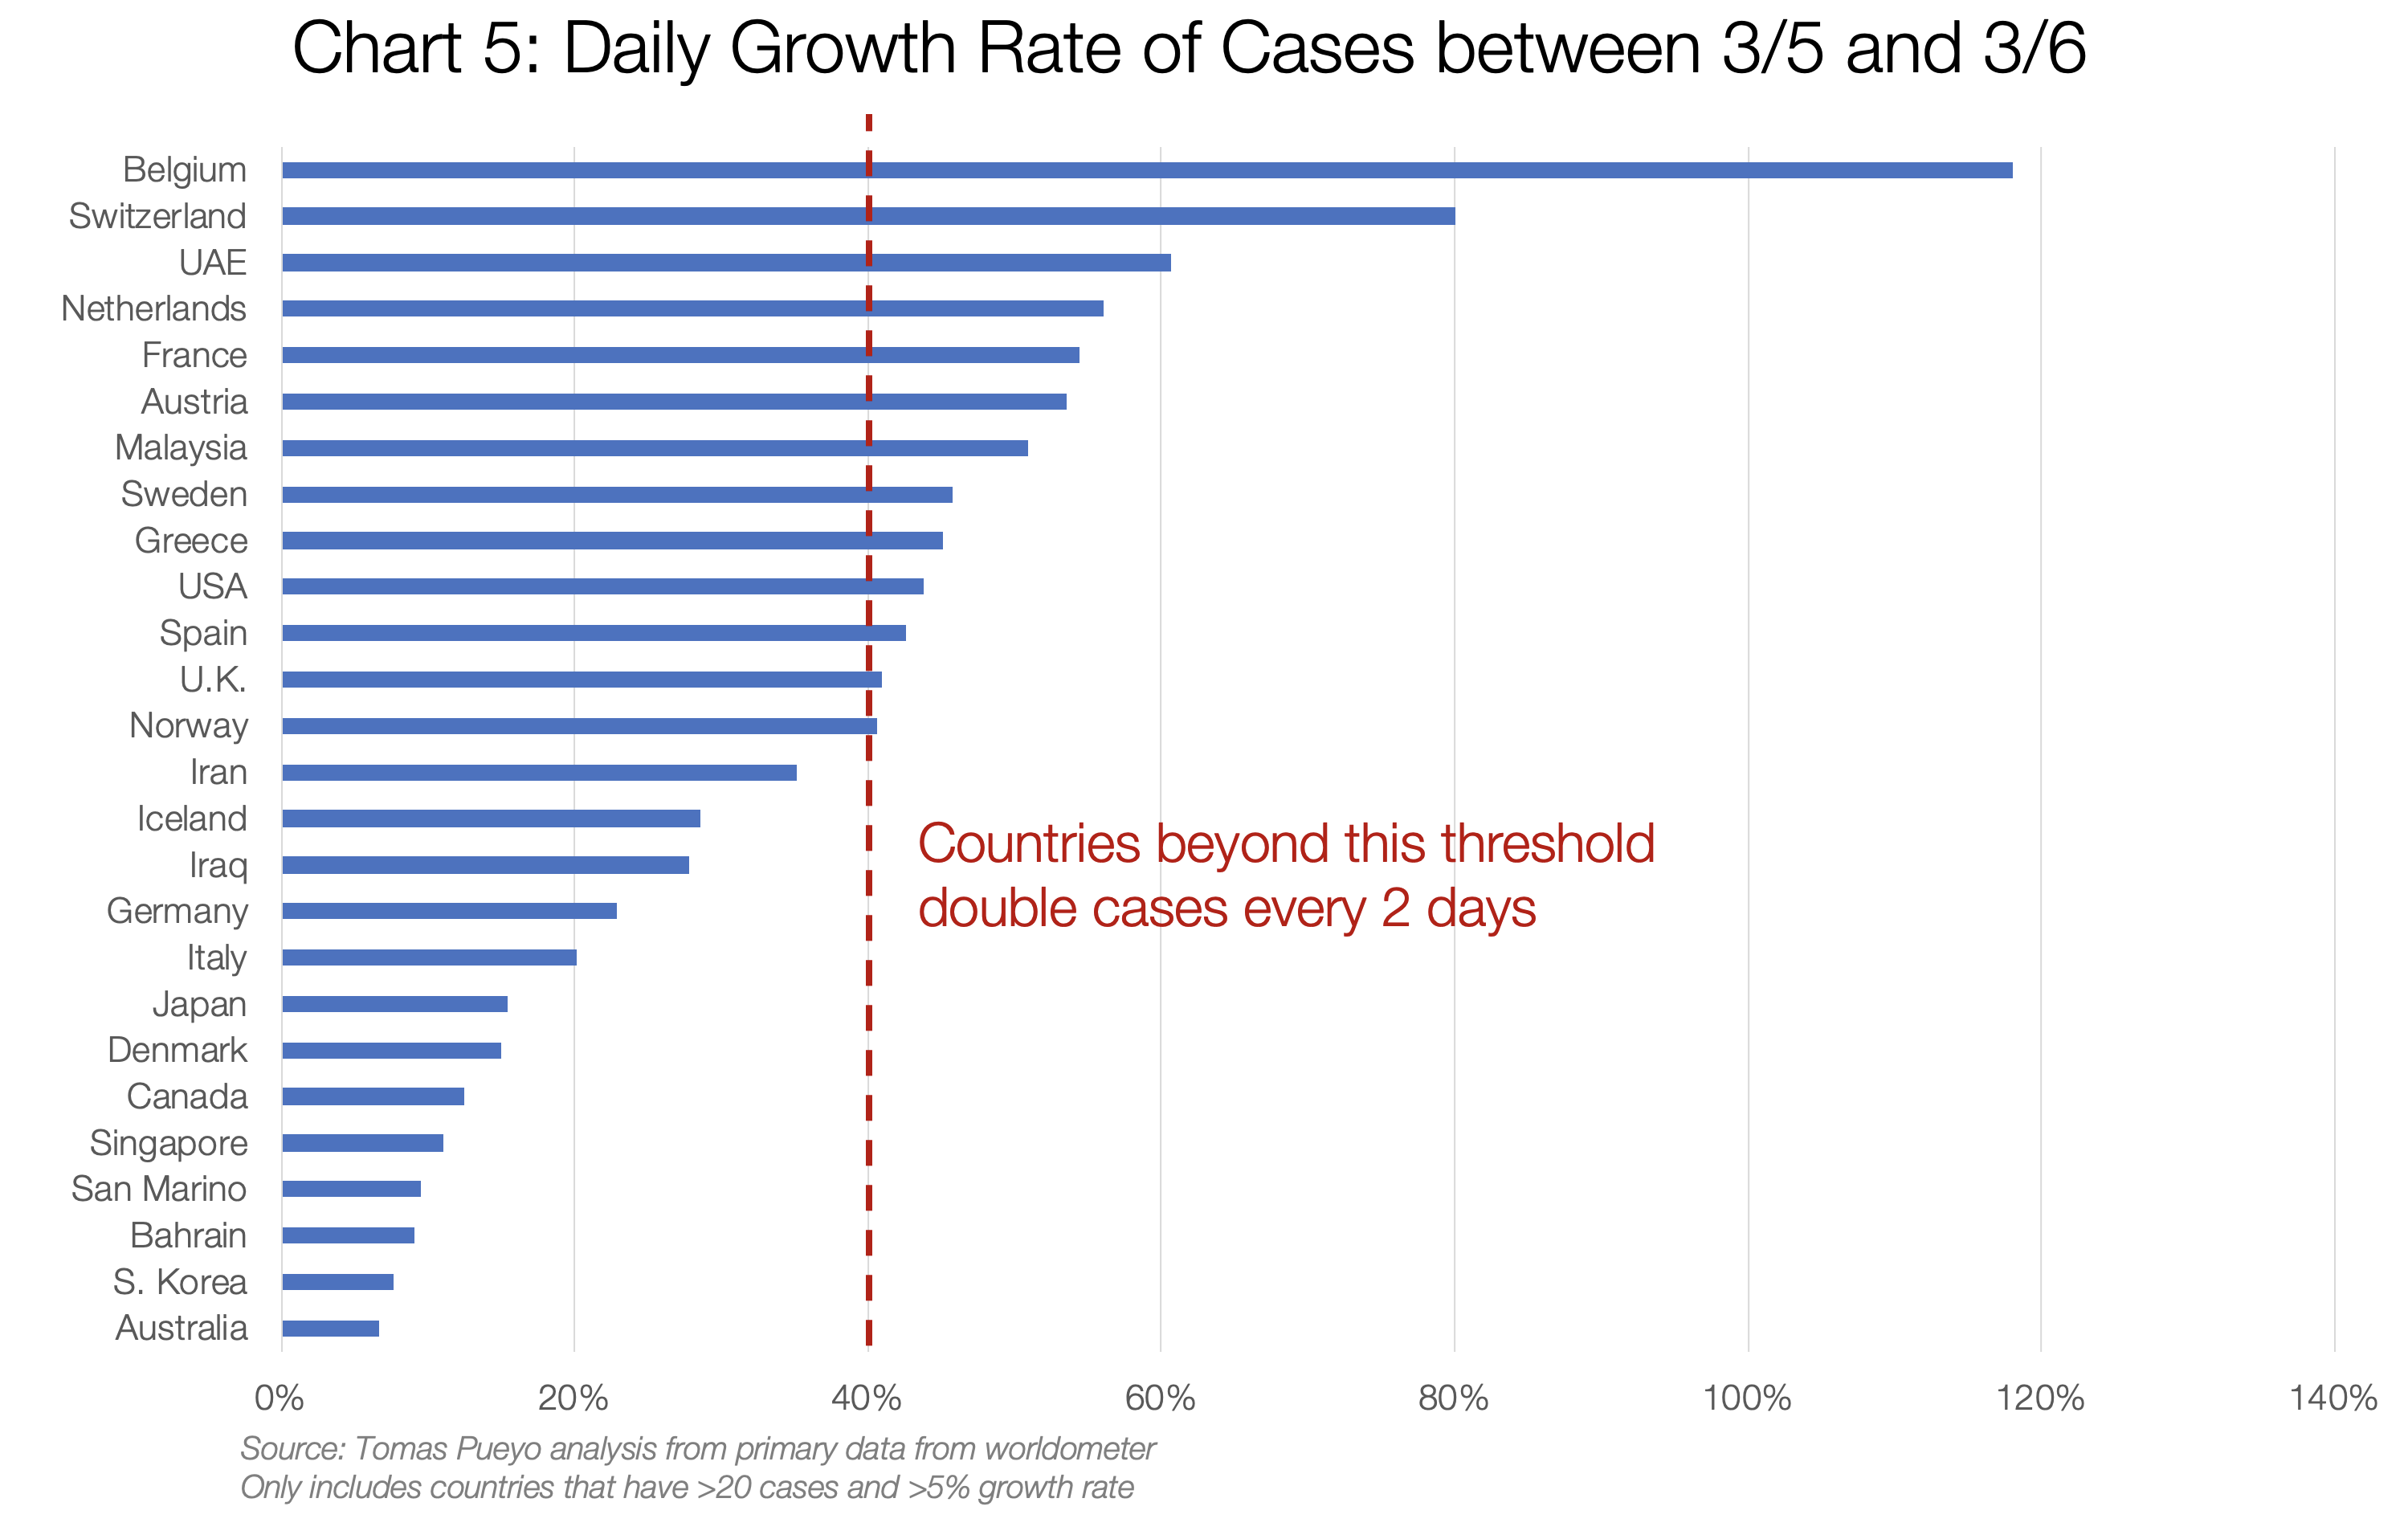
If you maintain this growth rate for even just one week, here's what you get:
If you want to understand what will happen — or how to prevent it — you need to look at countries that have already been through it: China, Eastern countries with SARS experience, and Italy.
China
Source: author's visual analysis and data from the Journal of the American Medical Association
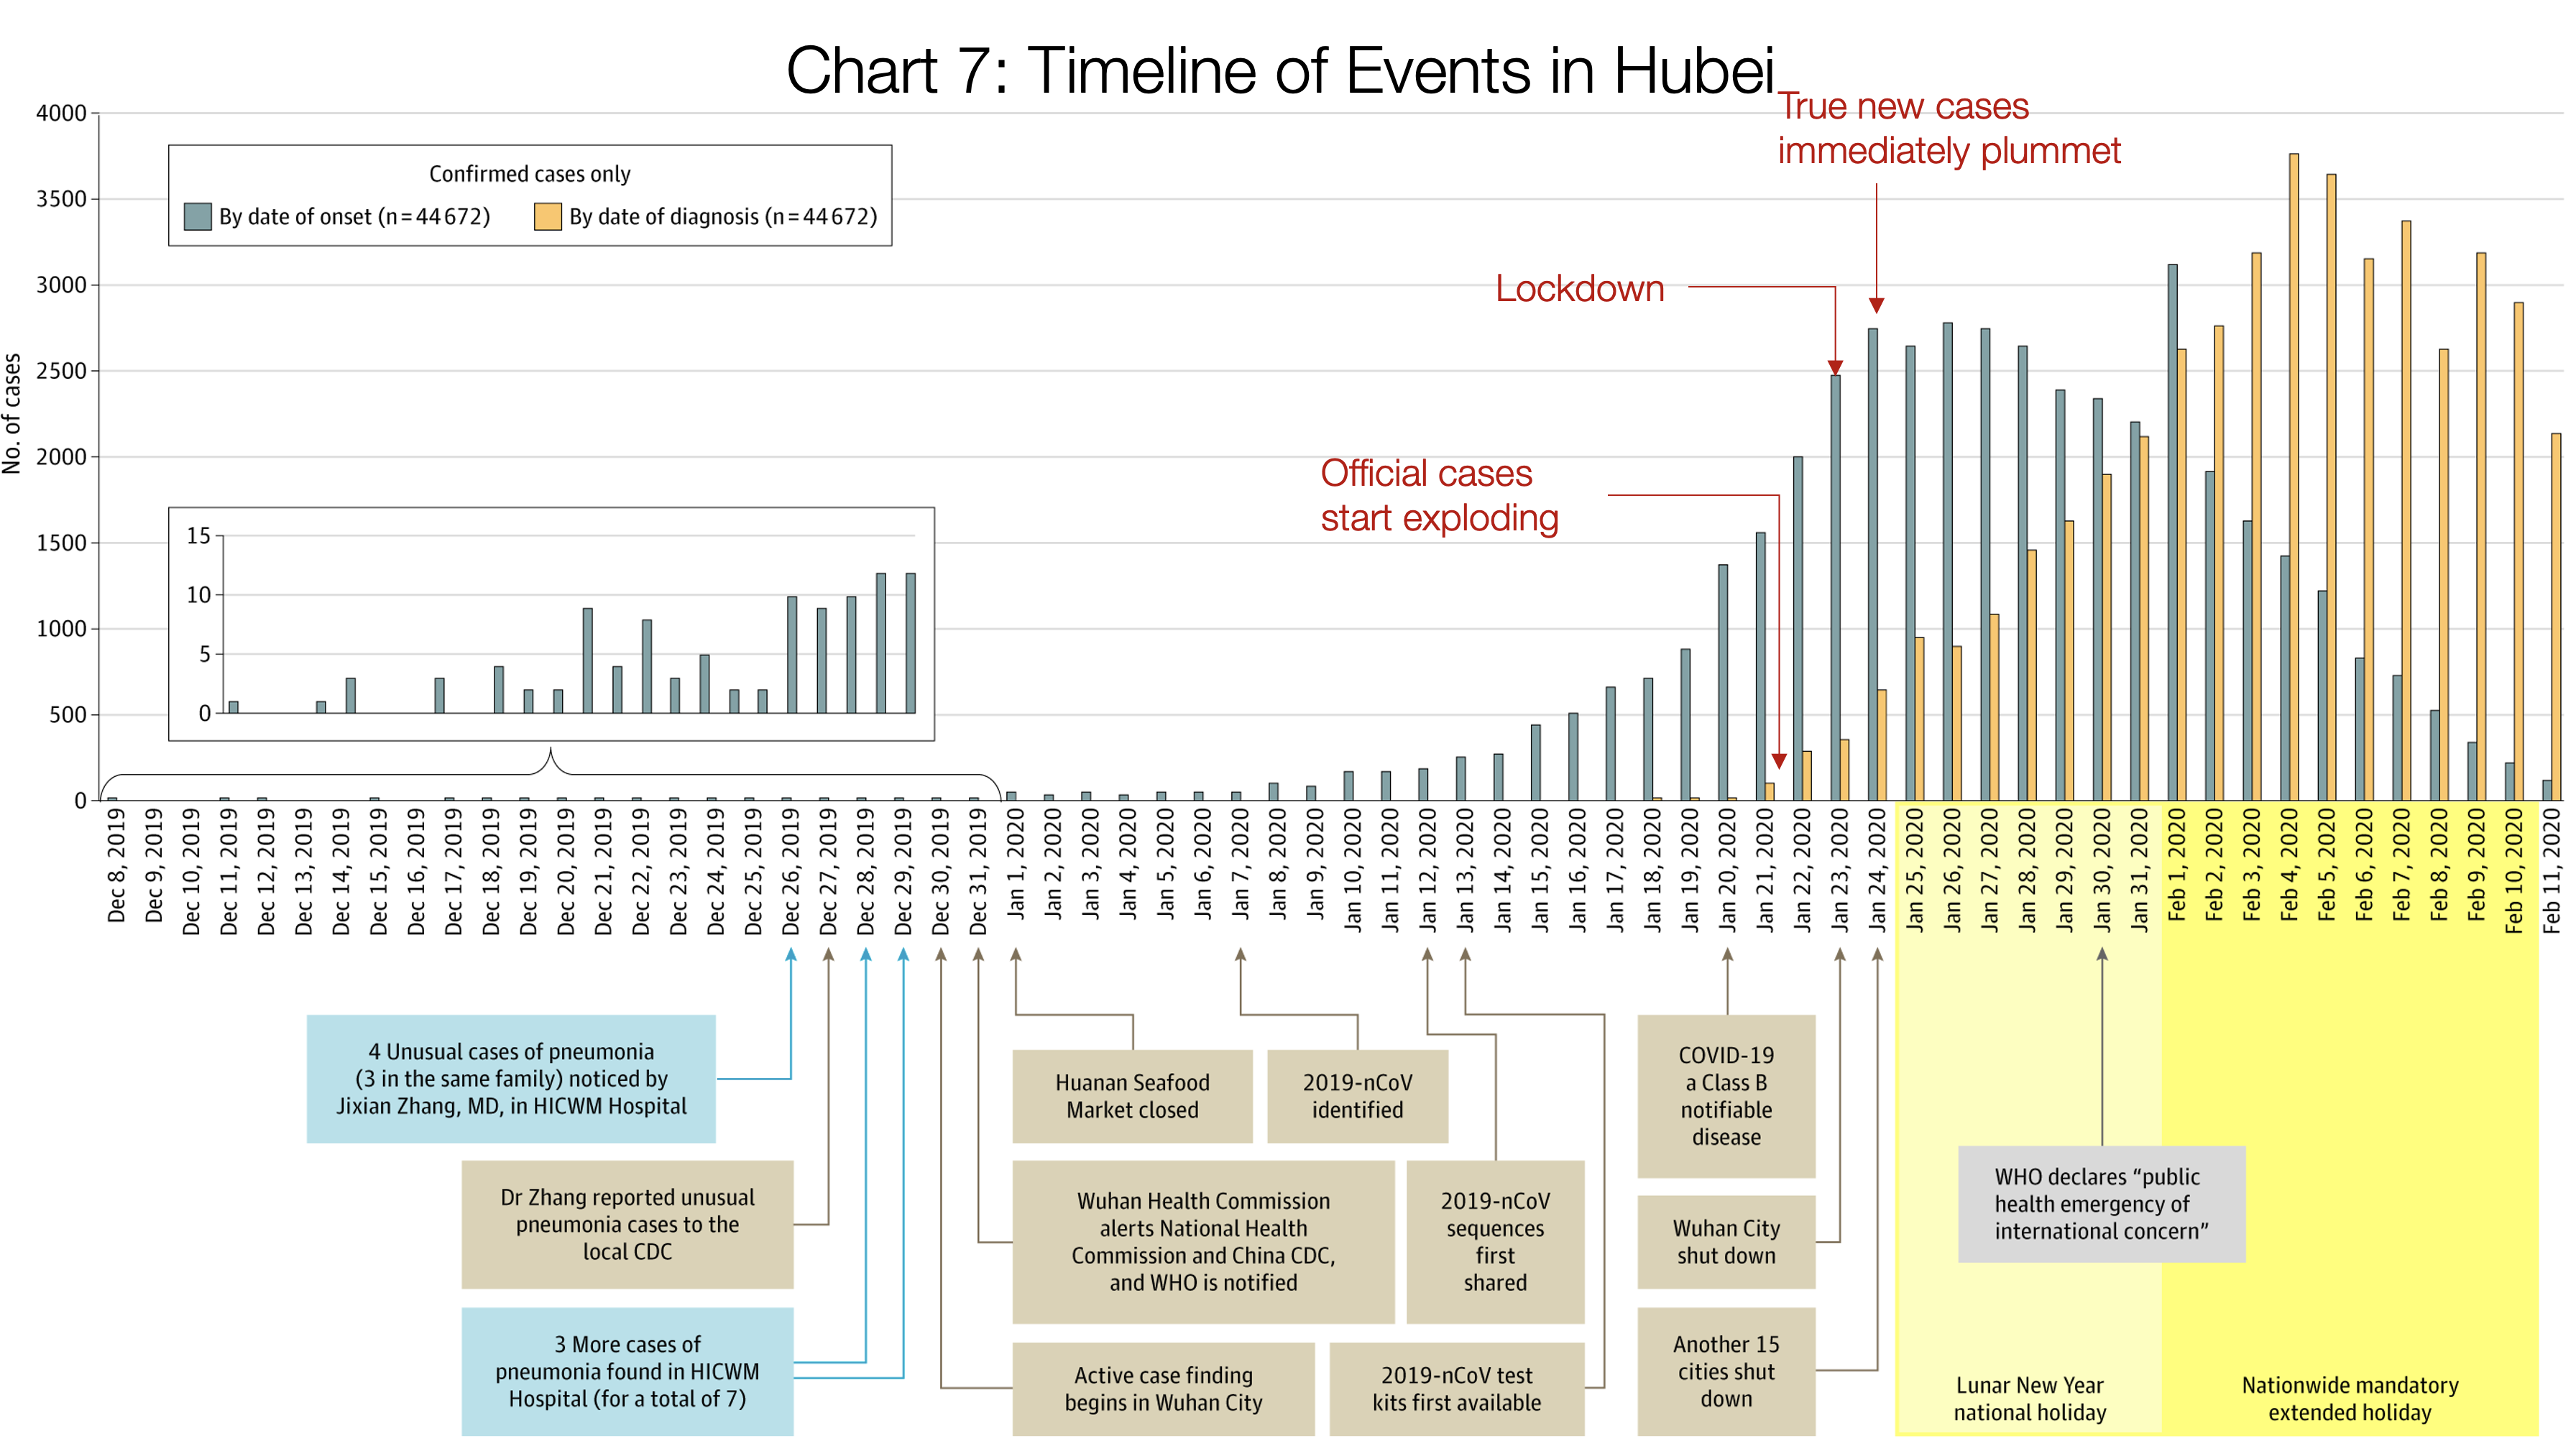
This is one of the most important charts.
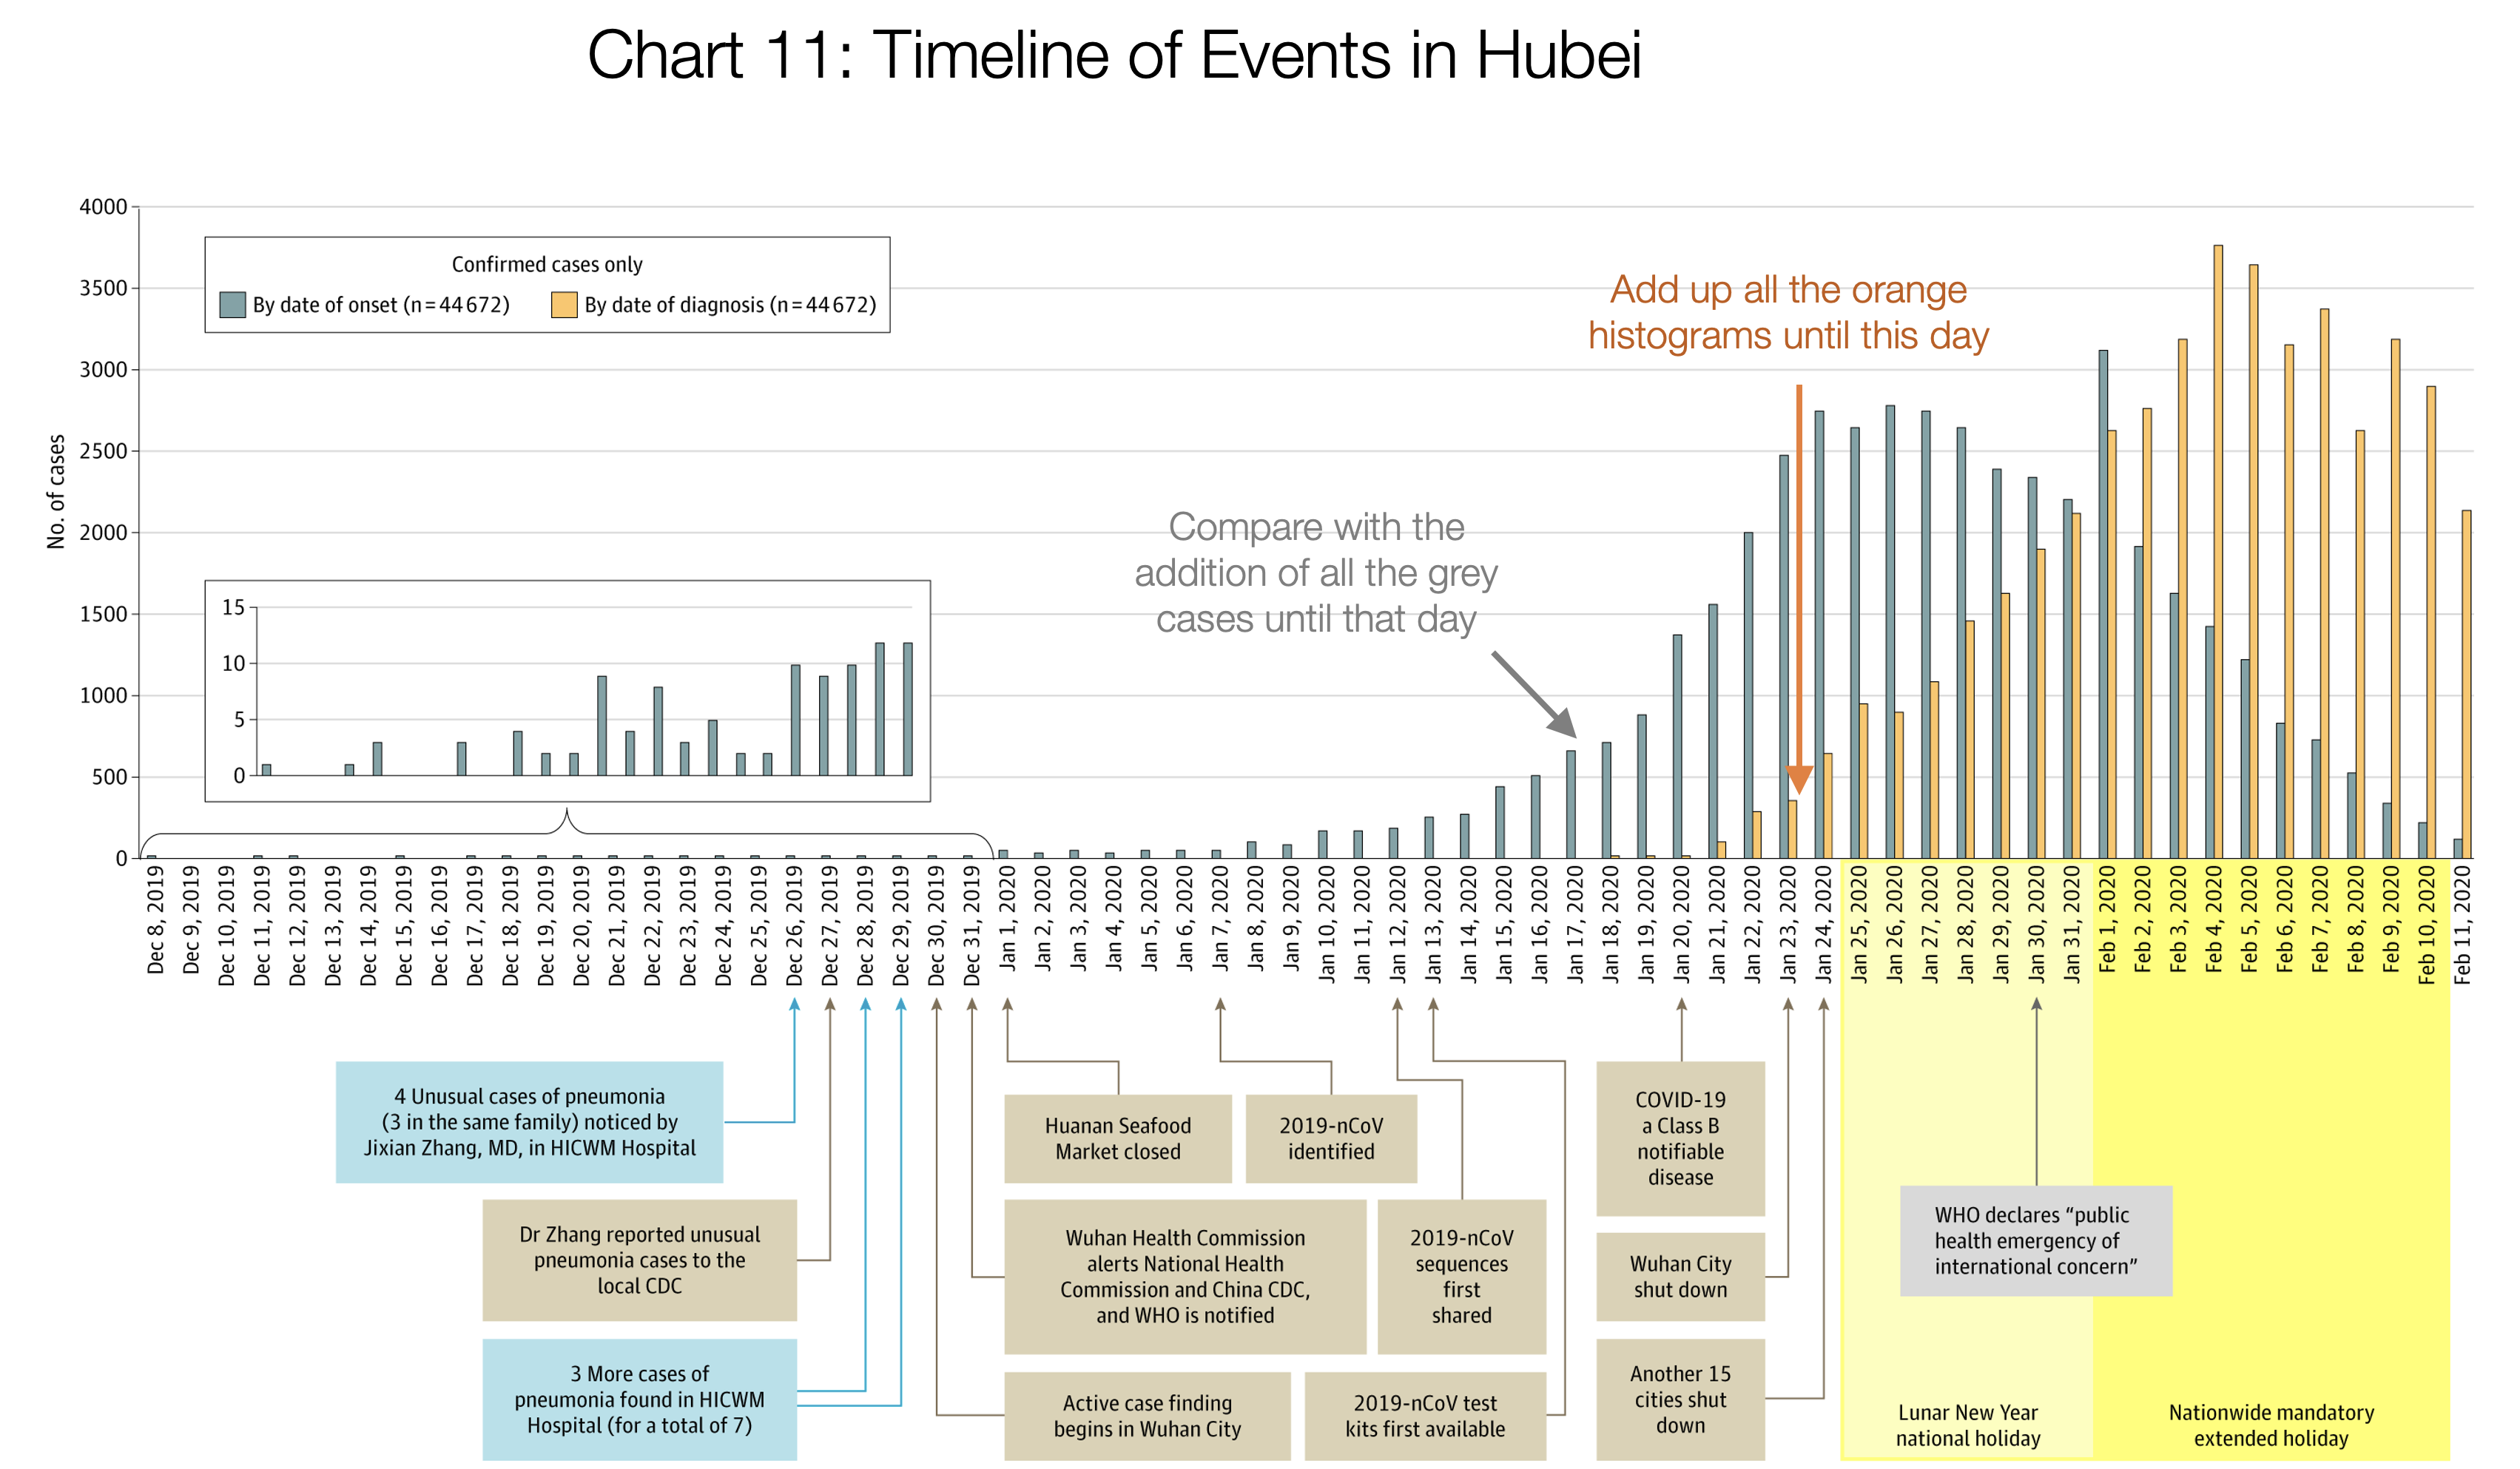
The orange bars represent the daily official number of cases in Hubei province: how many people were diagnosed on that day.
The gray bars show the true daily number of coronavirus cases. Critically, these were not known at the time. We can only figure them out in retrospect.
So the orange represents what the authorities knew, and the gray represents what was actually happening.
The number of new diagnosed cases (orange) shoots up on January 21st: about a hundred. In reality, there were 1,500 new cases that day, growing exponentially. But the authorities didn't know that — all they knew was that a hundred new cases had suddenly appeared.
Two days later, the authorities locked down Wuhan. At that point, the number of daily diagnosed new cases was around 400. Note this number: they decided to lock down a city over just four hundred new cases per day. In reality, there were 2,500 new cases that day, but they didn't know that.
The next day, 15 more cities in Hubei province were shut down.
Look at the gray chart before January 23rd, when Wuhan was still open: it's growing exponentially, cases are multiplying at a monstrous pace. As soon as Wuhan locked down, growth slowed. On January 24th, when 15 more cities shut down, the growth in true case numbers (we're still talking about the gray bars) stopped. Two days later, the maximum number of new cases was reached, and it's been declining since.
Note that official (orange) cases were still growing exponentially, and for 12 days it could have looked like the epidemic was exploding. In reality, that wasn't true — symptoms were just getting worse, people were seeing doctors more often, and the detection system became more effective.
This concept of official cases versus true cases is very important. Let's remember it and come back to it later.
The rest of China's regions were well-coordinated by the central government, so they took immediate and decisive measures. Here's the result:
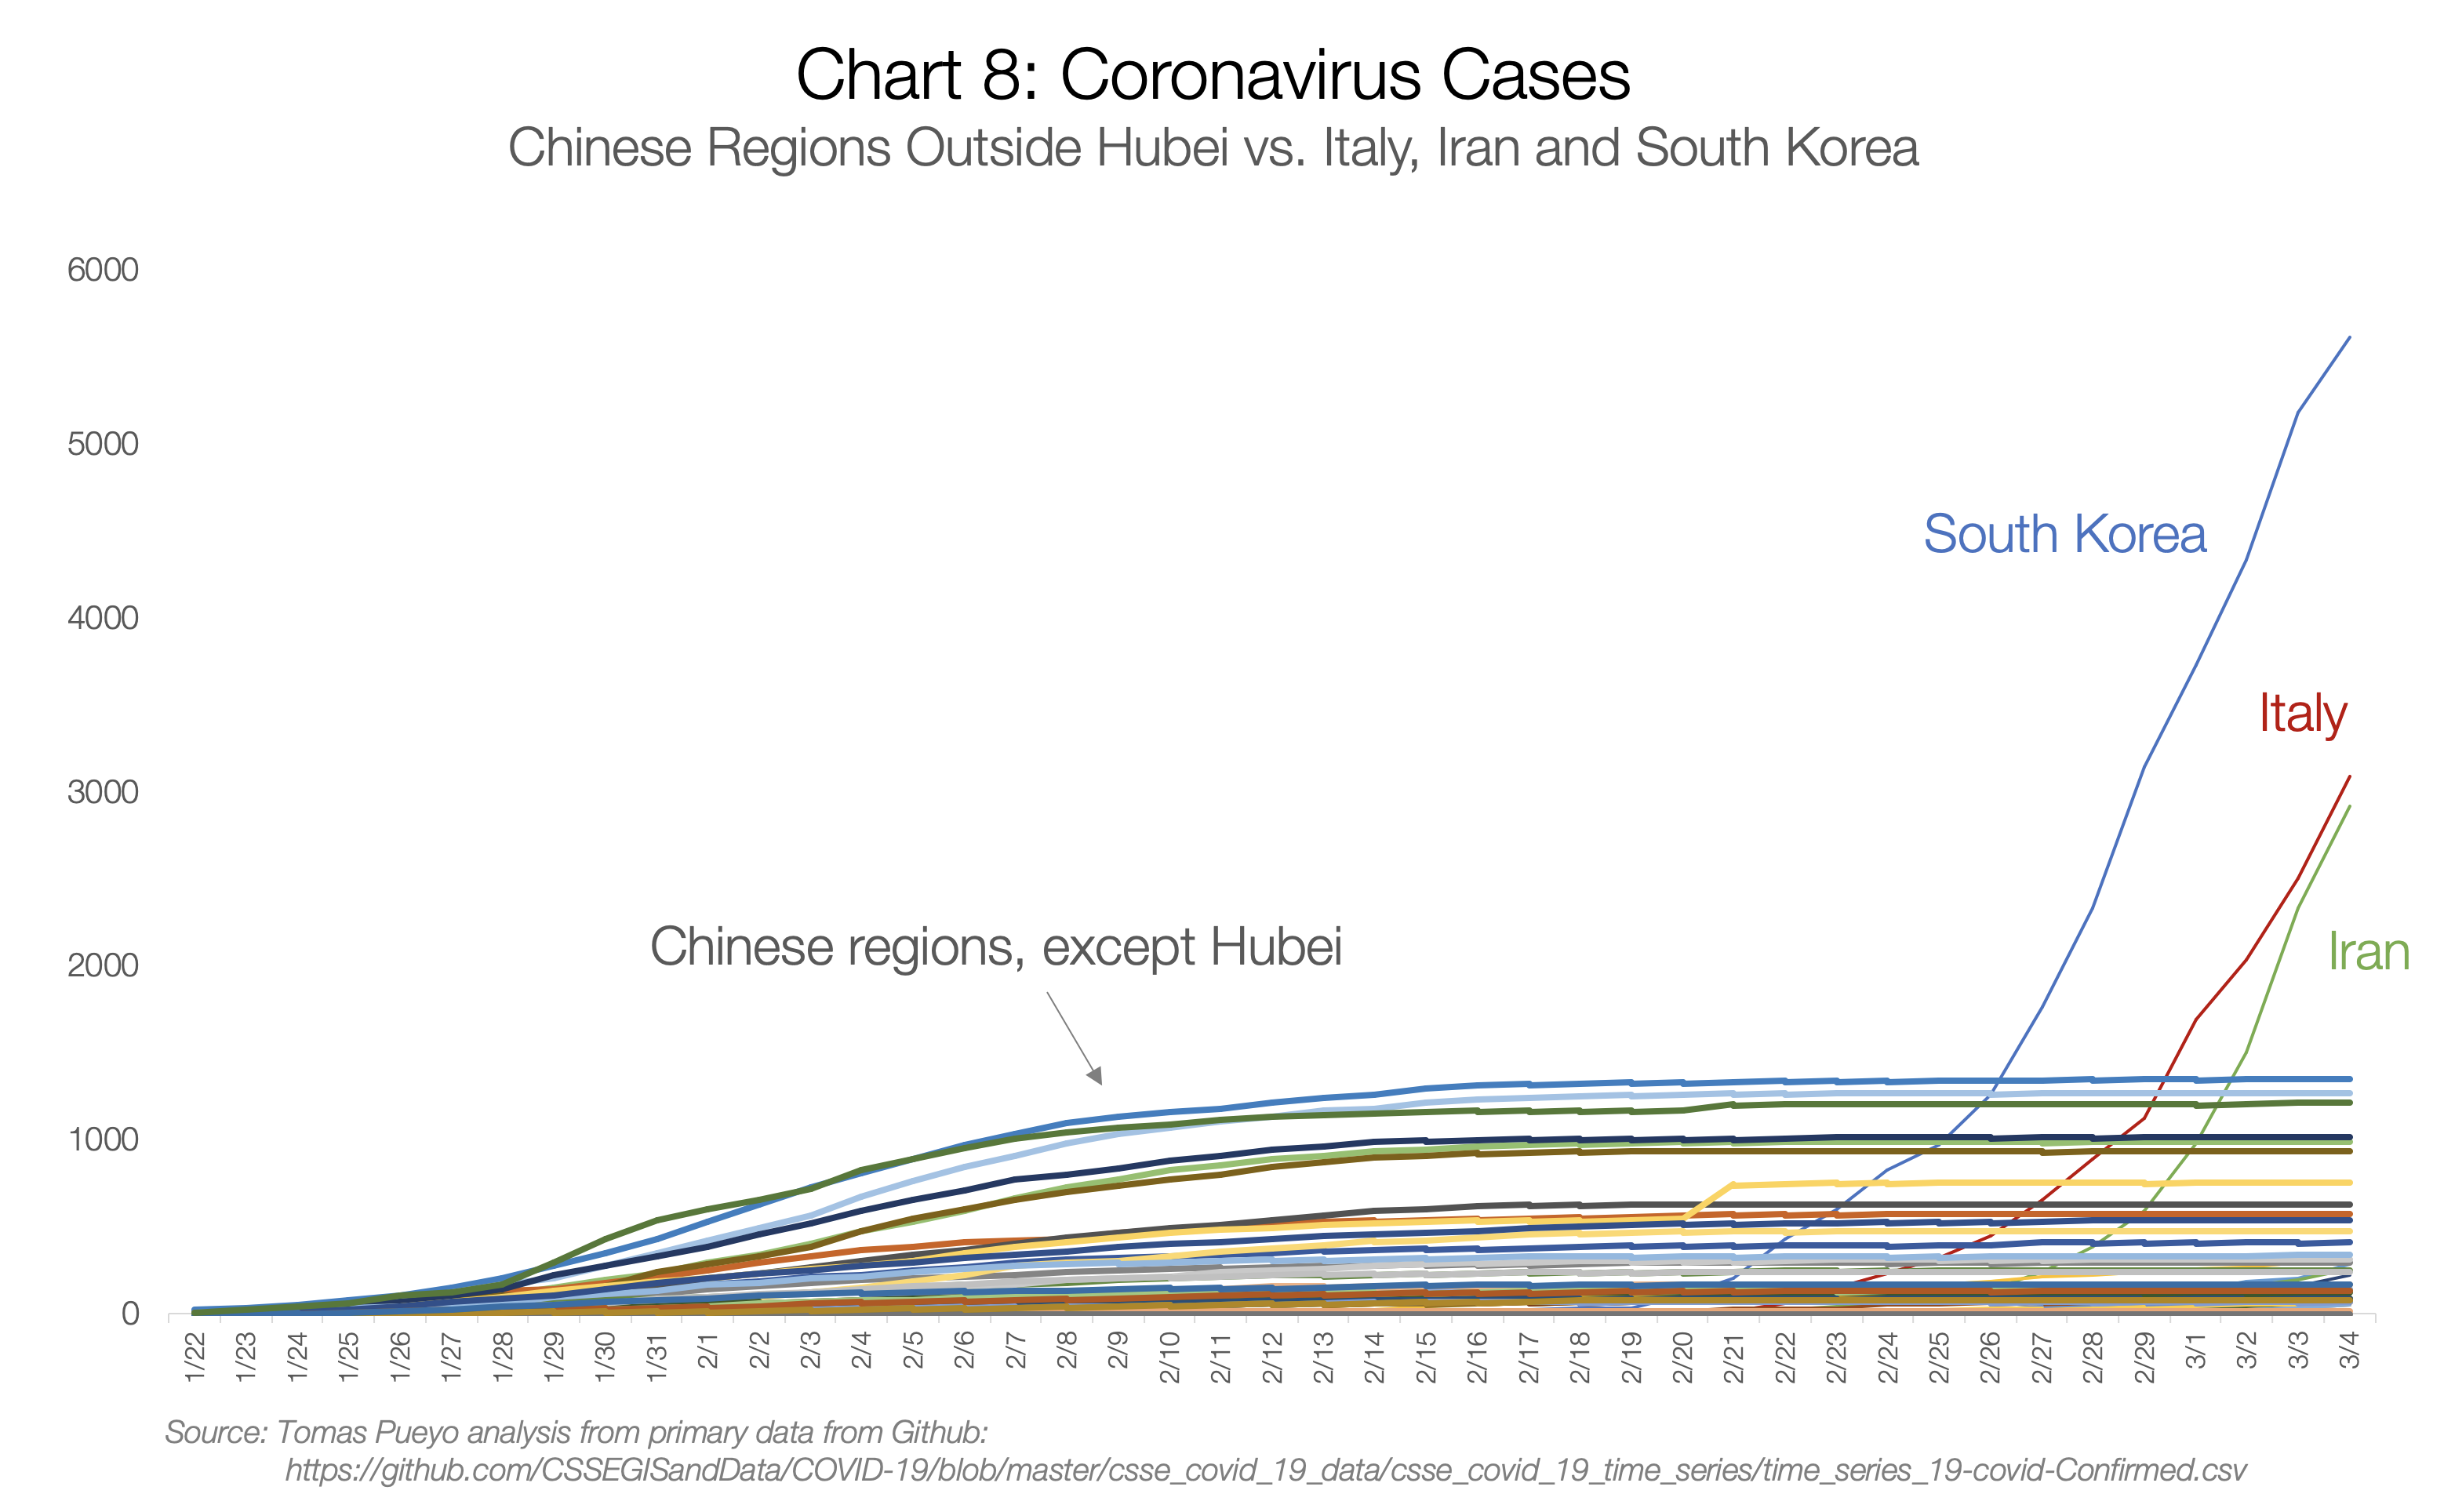
Each flat line is a Chinese region with coronavirus cases. Any of them could have gone exponential, but thanks to the measures taken in late January, they all stopped the virus before it could spread.
Meanwhile, South Korea, Italy, and Iran had a full month to learn from others' experience, but they didn't. Starting with the same exponential growth as Hubei, they overtook all Chinese regions by the end of February.
Eastern Countries
South Korea had explosive growth — but it's curious why Japan, Taiwan, Singapore, Thailand, or Hong Kong didn't?
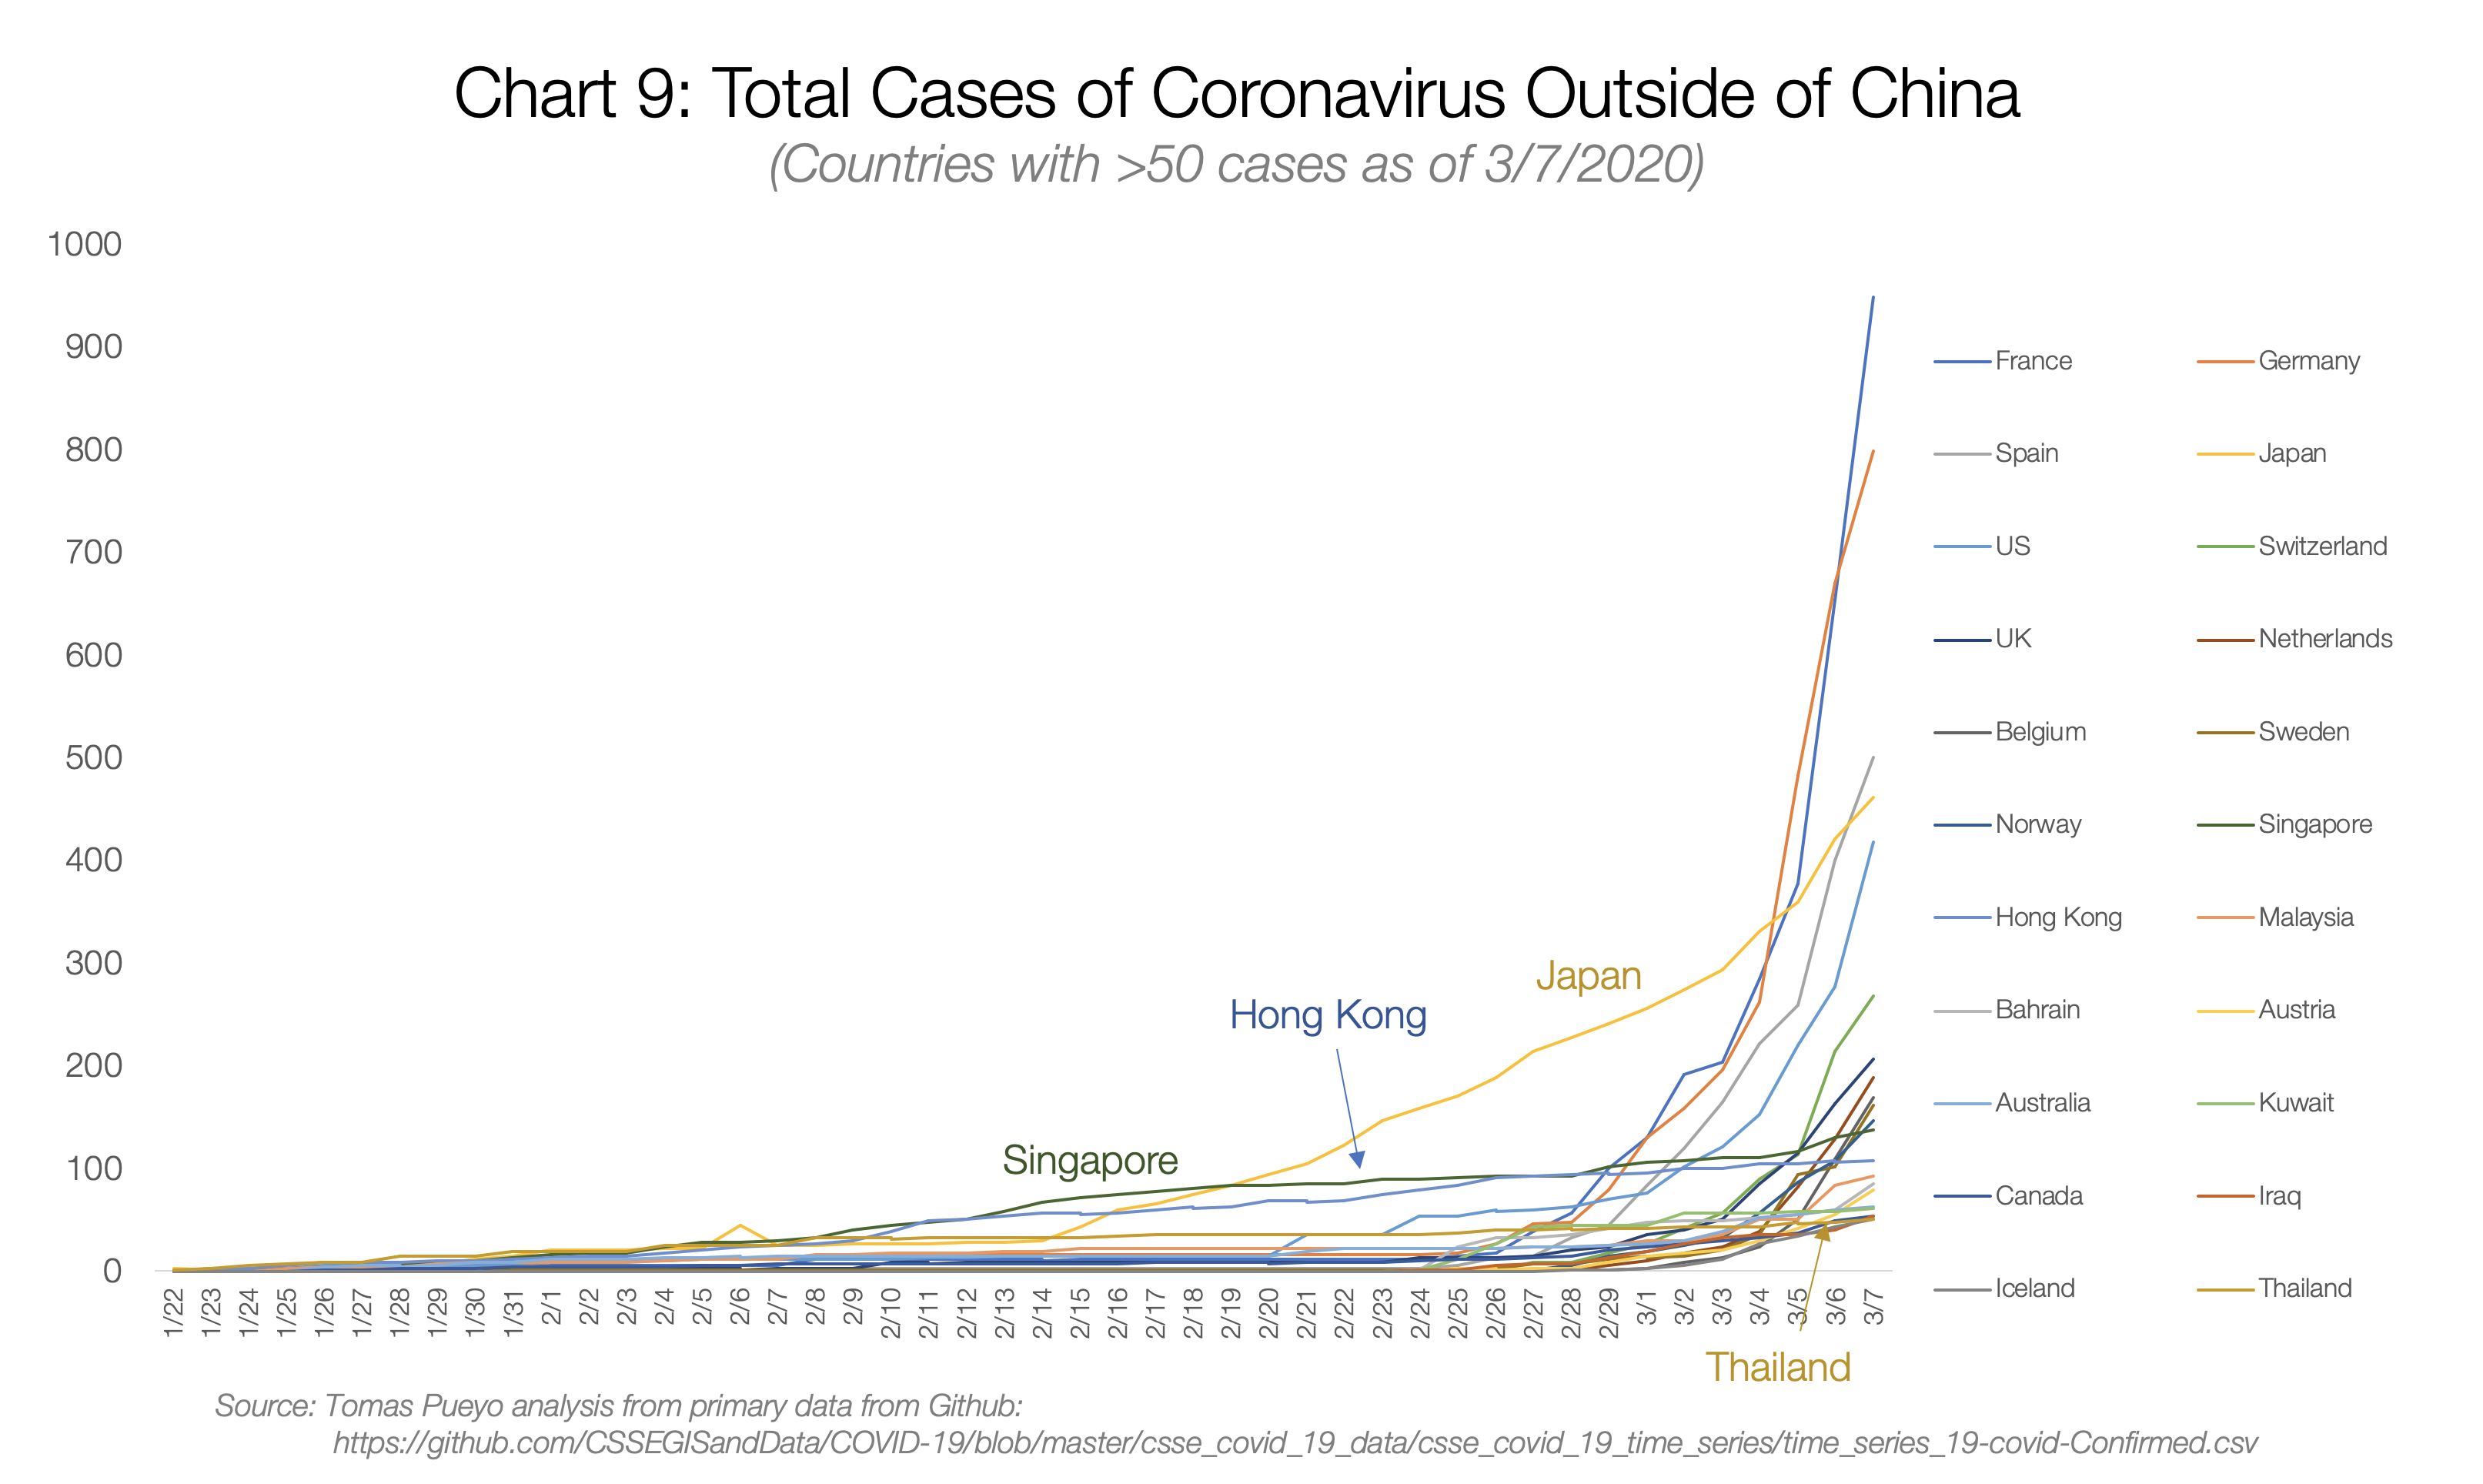
Taiwan isn't even on the chart because it didn't exceed the 50-case threshold chosen for visualization.
All of these countries were affected by SARS in 2003, and all of them learned something. Having seen how viral and deadly such a disease could be, they understood they needed to take it seriously. That's why their charts, despite starting to grow much earlier, still don't look exponential.
So we have stories of coronavirus outbreaks, of governments recognizing the threat and containing them. For the rest of the countries, however, the story will be completely different.
Before I move on to them, a note about South Korea: this country is probably an exception. The coronavirus was contained within the first 30 cases, but patient number 31 turned out to be a super-spreader who transmitted the virus to thousands of others. Since transmission happens before symptoms appear, by the time authorities realized the problem, the virus was already out. They are now paying for the consequences of that case, but their containment efforts are showing effectiveness: Italy has already surpassed it in case numbers, and Iran will overtake it by March 10.
United States: Washington State
You've already seen the growth in Western countries and know how depressing the projections look just one week ahead. Now imagine that containment doesn't happen like in Wuhan or other Eastern countries, and you get a colossal epidemic. Let's examine a few cases — such as Washington State, the San Francisco Bay Area, Paris, and Madrid.
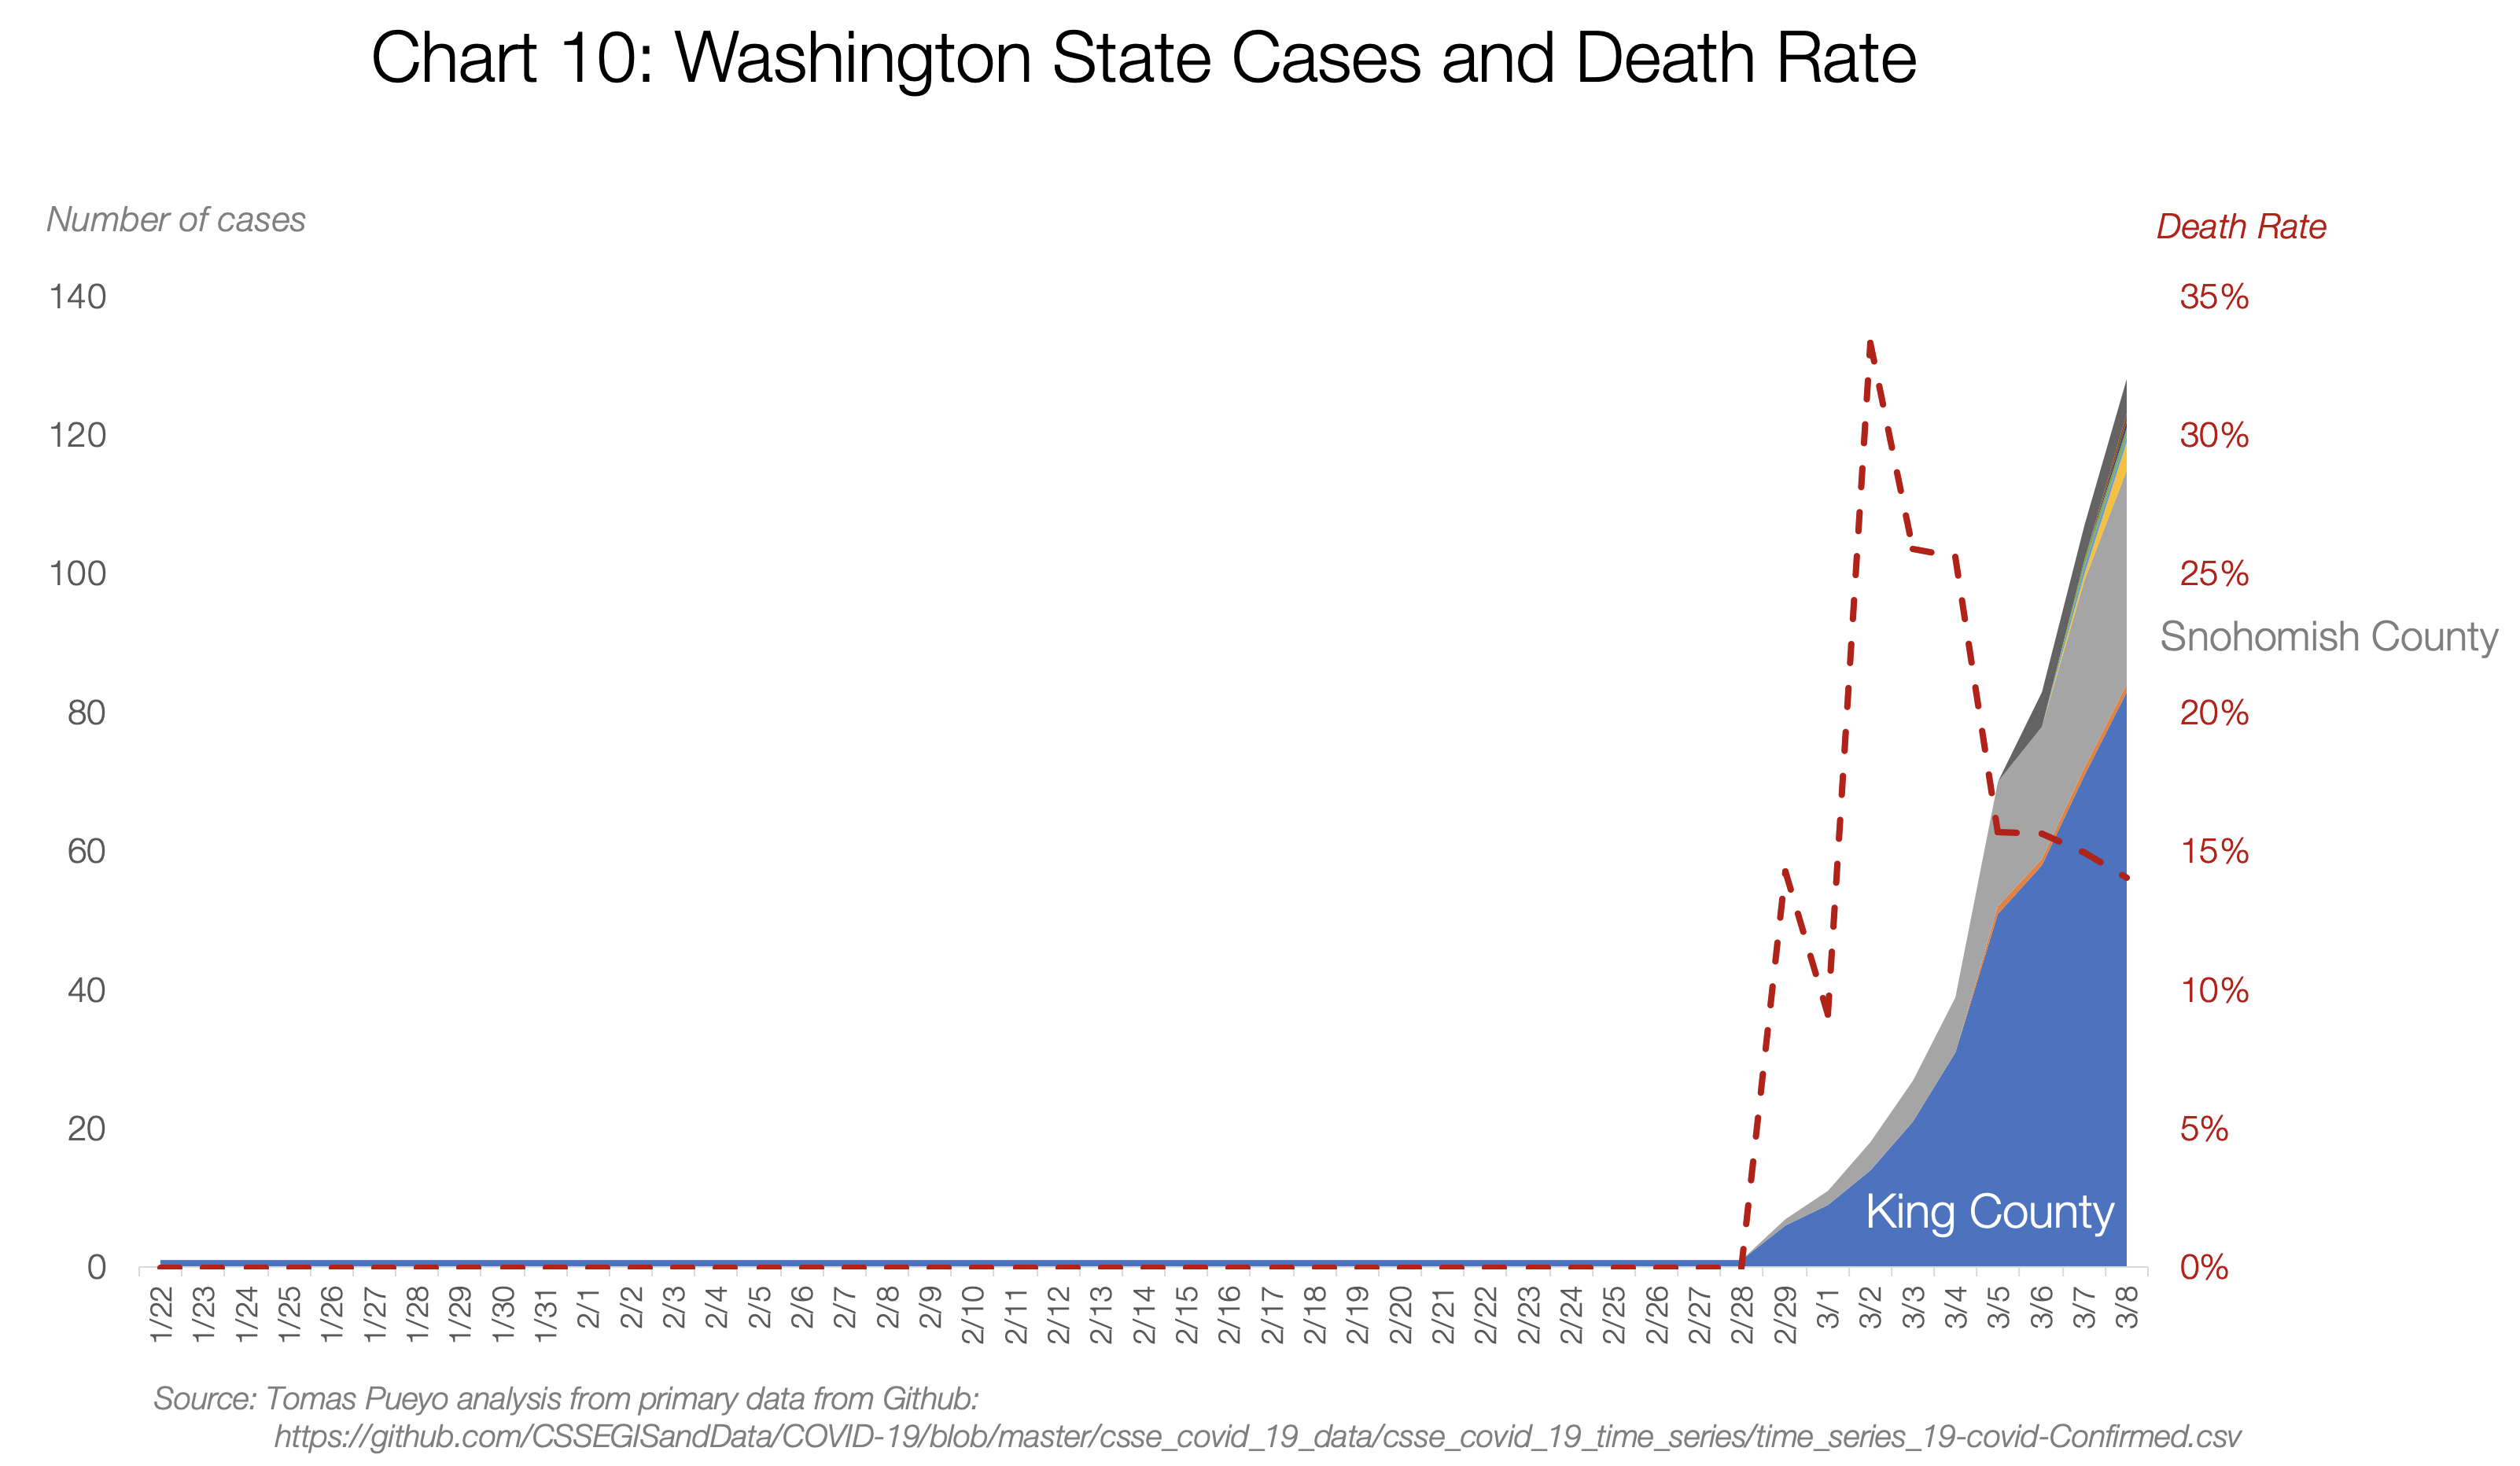
Washington State is America's Wuhan. The number of cases there is growing exponentially, currently at 140.
But the most interesting thing happened at the very beginning — the fatality rate was off the charts. At one point, the state had three cases and one death. From other places, we know the coronavirus fatality rate is between 0.5% and 5% (more on this later). How could it be 33%?
It turns out the virus had been spreading undetected for weeks. It didn't look like there were only three cases — rather, the authorities only knew about three, and one of them was dead, because the more serious the condition, the more likely someone gets tested for the virus.
This is a bit like our orange-gray bars in China: here they only knew about the orange (official) cases and things looked fine (just three). But in reality, there were hundreds, maybe thousands of true cases.
This is the difficulty: you only know the official situation, not the true one. You need to find out what's really happening. How do you estimate the true number of cases? It turns out there are a couple of ways. And I have a model for both, so you can play with the numbers too (here's a direct link to copy the model).
First, through deaths. If there are deaths in your area, you can use that number to estimate the true current number of cases. We roughly know how long it takes on average to die after contracting the virus — it's 17.3 days. So a person who died on February 29th in Washington State was likely infected around February 12th.
We also know the fatality rate. In this scenario, we use 1% (details discussed later). This means that around February 12th, there were already about a hundred cases in the region, and only one of them resulted in death 17 days later.
Now use the average doubling time for coronavirus — it's 6.2 days. So in the 17 days before this person's death, the number of cases should have multiplied by approximately 8 (=2^(17/6)). This means that if you're not diagnosing every single case, just one confirmed death per day means 800 true cases of infection on that same day.
Washington State currently has 22 deaths. Using our rough calculations, we get approximately 16,000 true coronavirus cases today alone. That's as many as the official cases in Italy and Iran combined.
If we look at the details, we find that 19 of those deaths came from a single cluster that may not have been spreading the virus widely. If we treat those 19 deaths as one, the total death count in the state is four — updating our calculations for this number, we still get approximately 3,000 cases today.
Trevor Bedford's approach examines the viruses themselves and their mutations to estimate the current number of cases.
The conclusion is that Washington State currently has approximately 1,100 cases.
None of these approaches is perfect, but they all point to the same thing: we don't know the true number of cases, but it's definitely much higher than the official count. Not by hundreds, but by thousands — or more.
United States: San Francisco Bay Area
Until March 3rd, the San Francisco Bay Area had no deaths. This made it difficult to estimate the true number of cases. The official count was 86, but the US estimate is known to be low because there weren't enough coronavirus test kits. A decision was made to create their own test kit, but it turned out to not work.
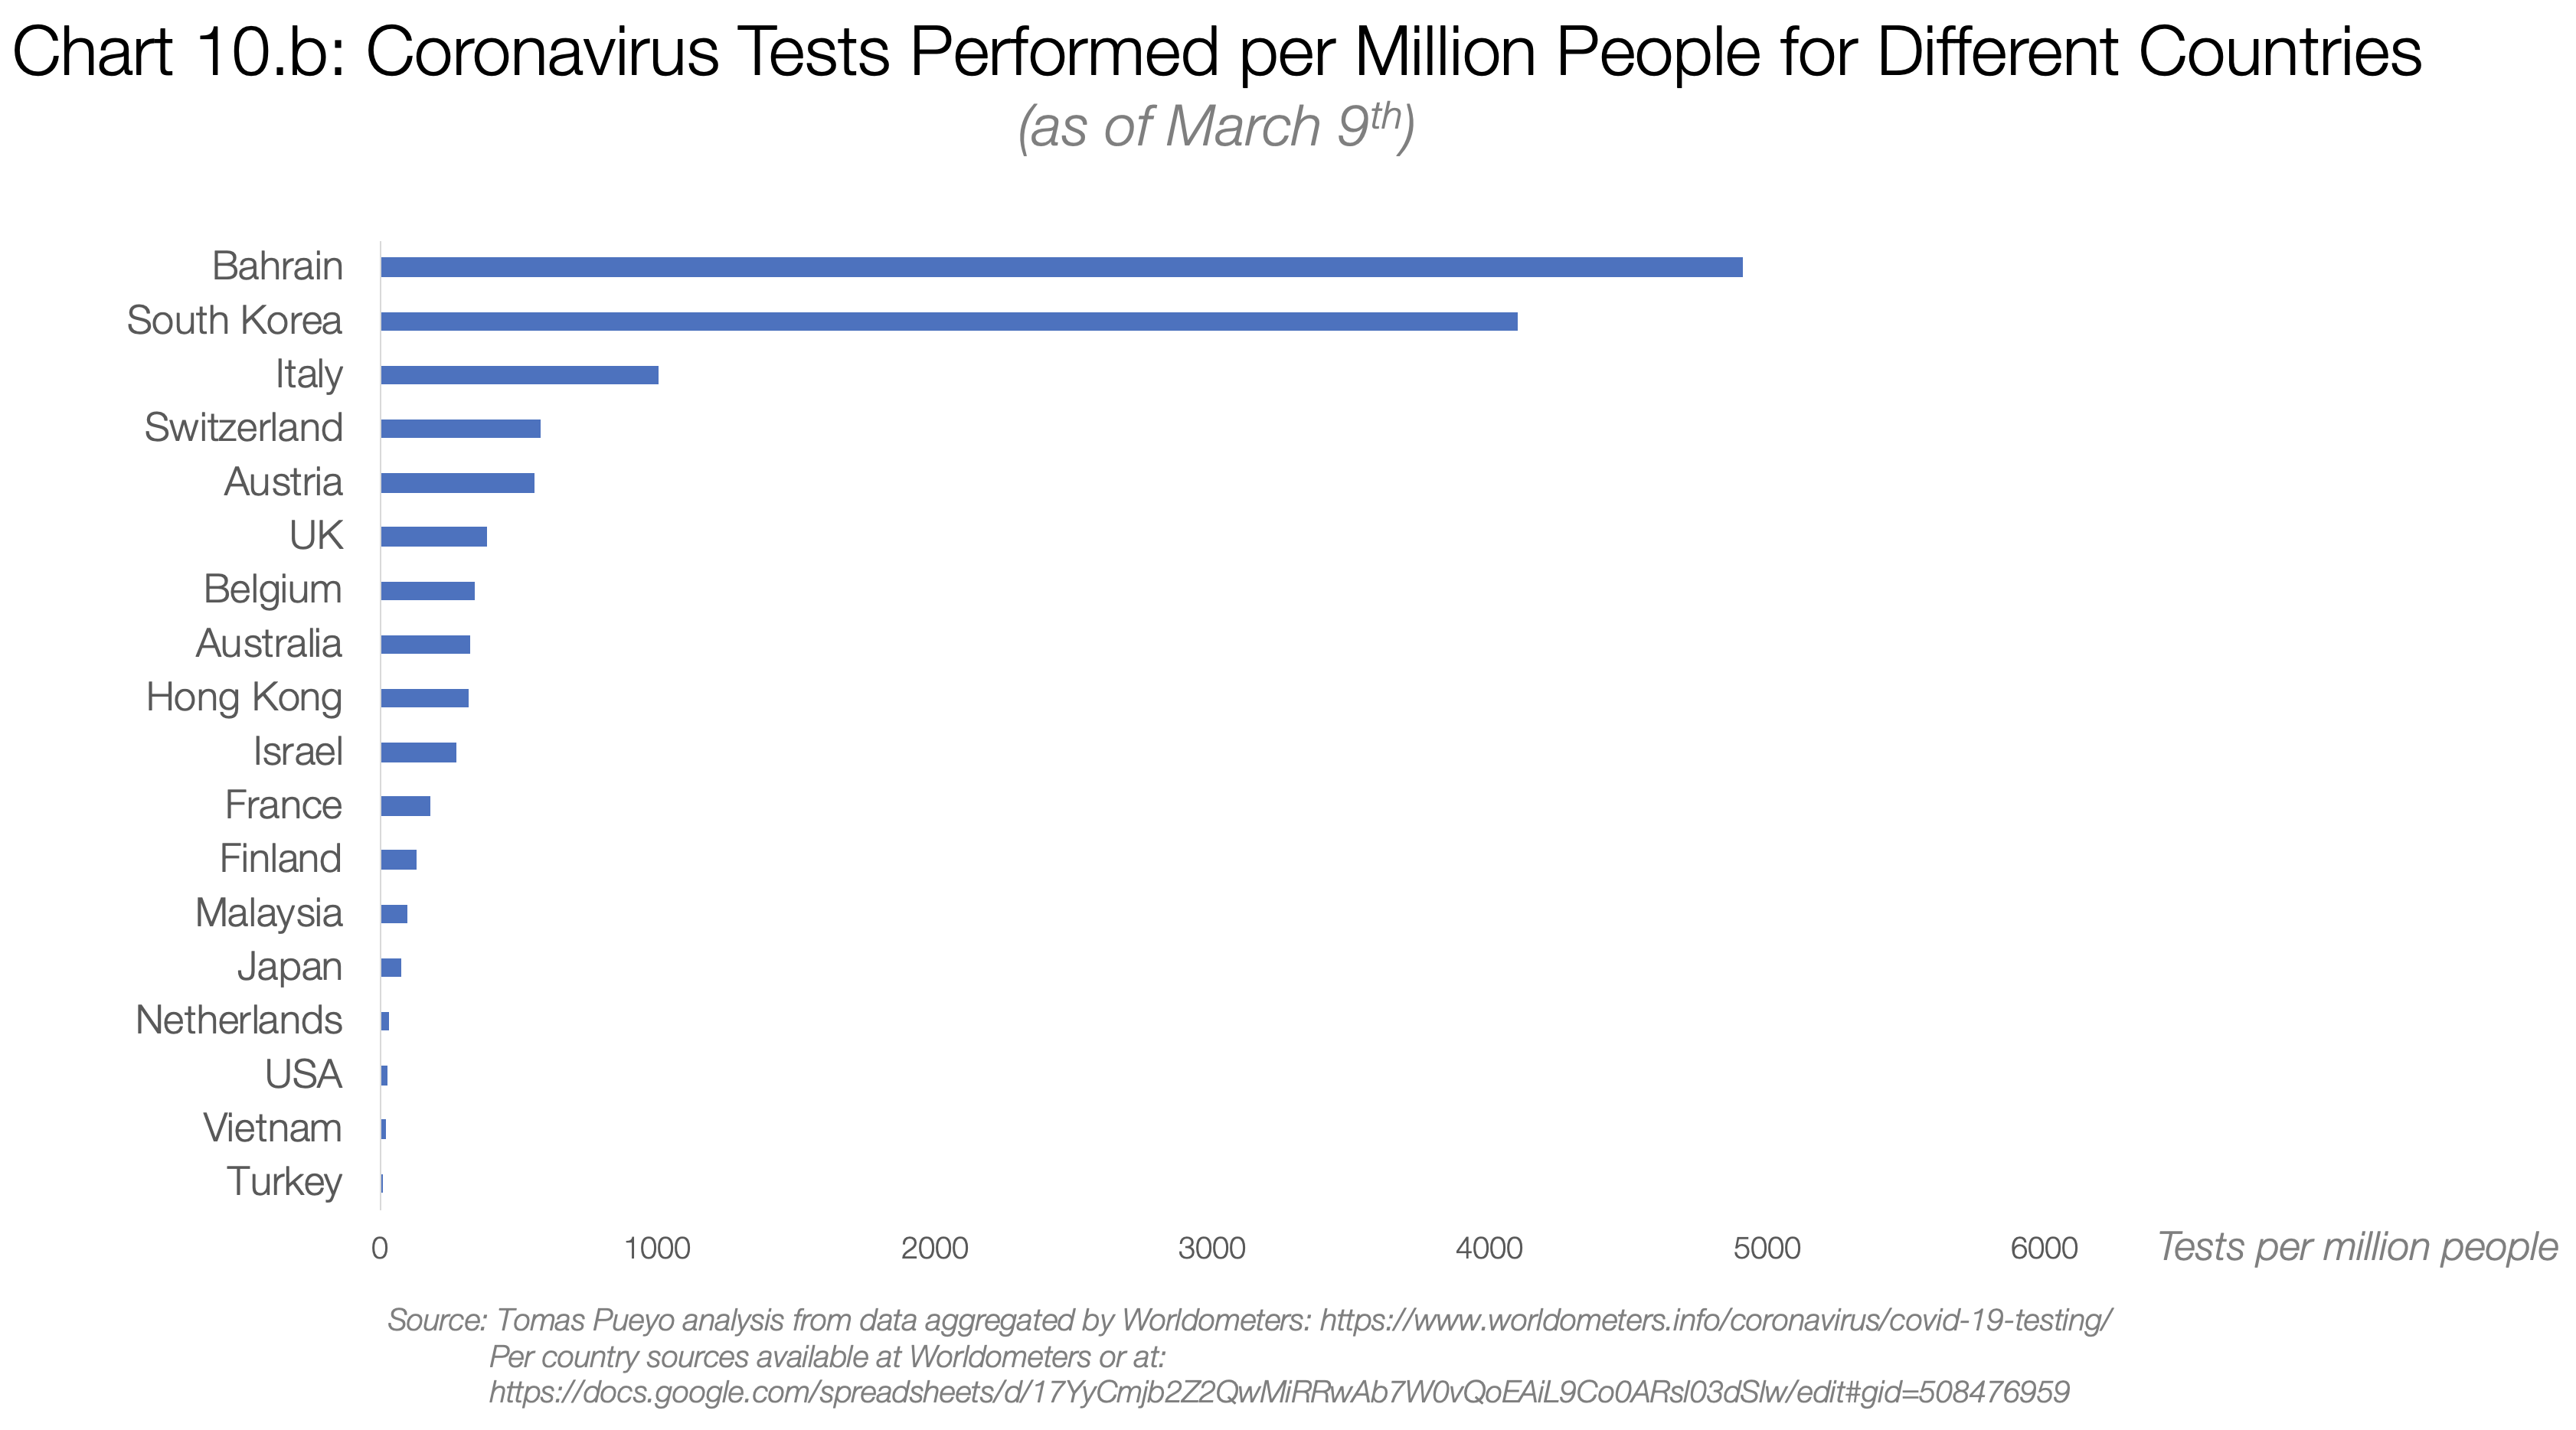
Here was the number of tests performed in different countries by March 3rd:
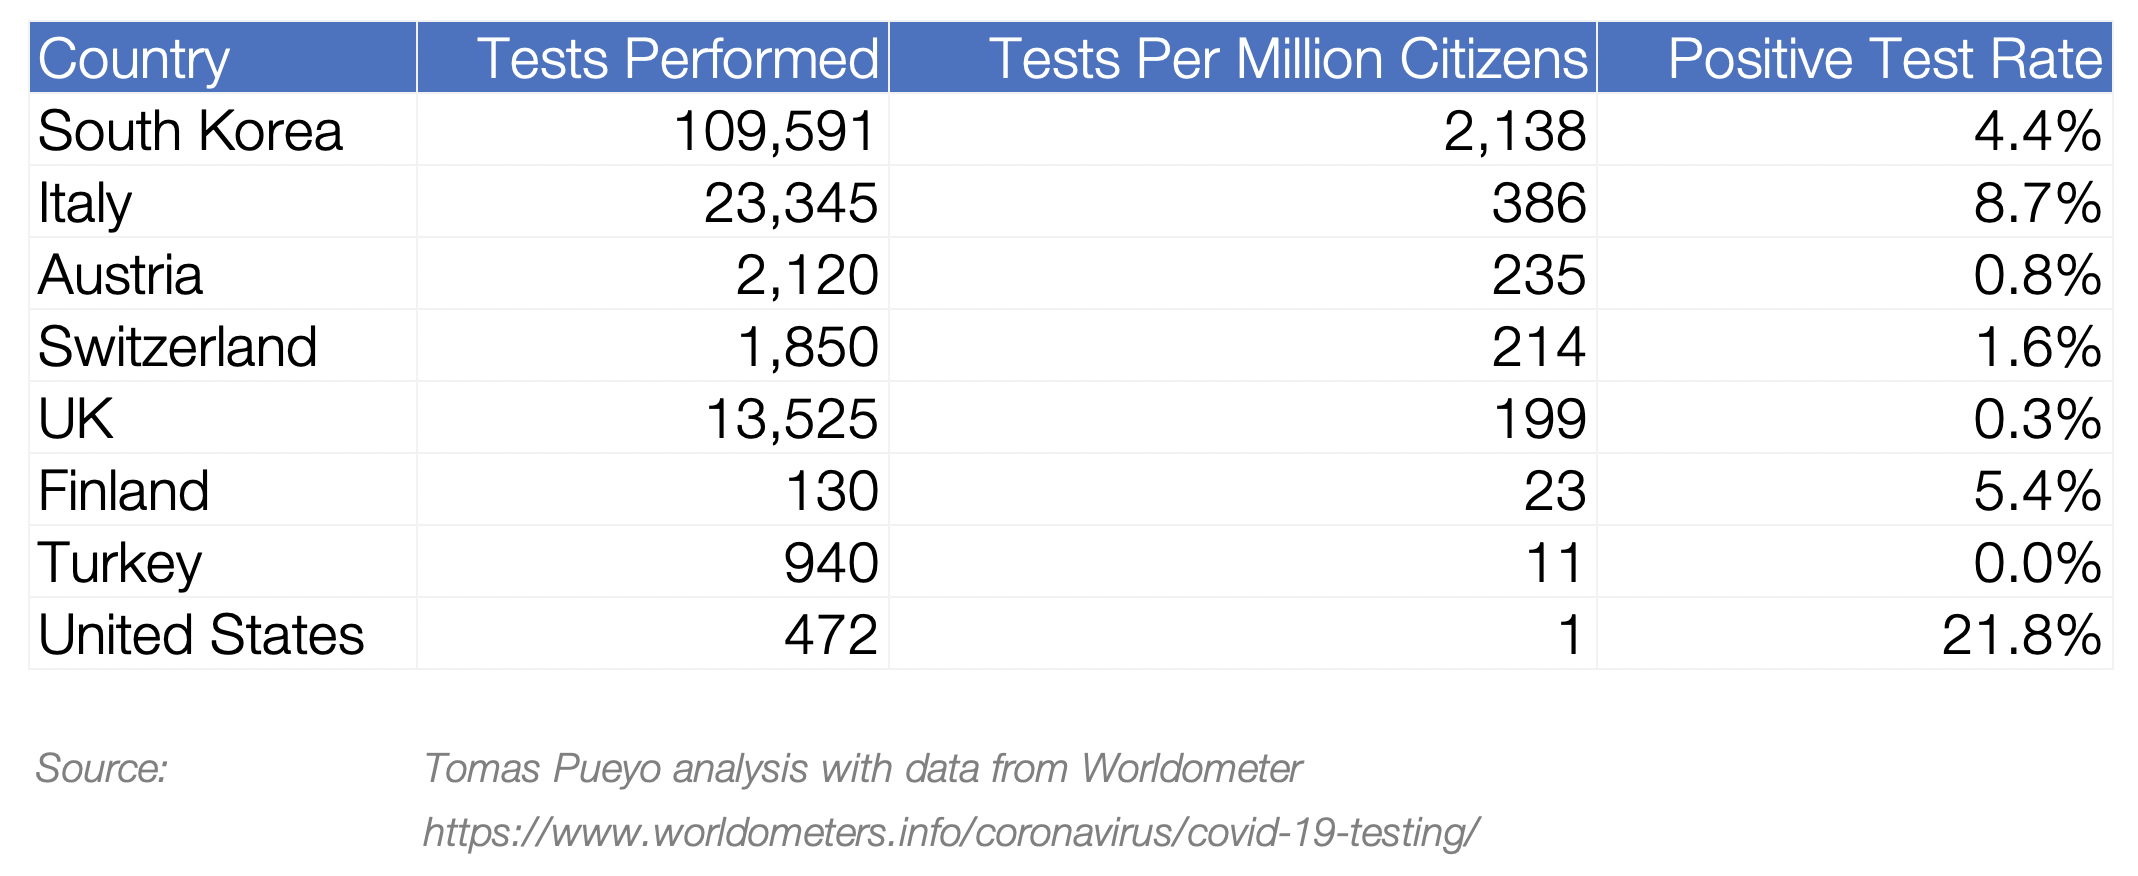
Turkey, which had zero coronavirus cases, was testing its population per capita 10 times more frequently than the US. Today the situation is not much better: the US has conducted approximately 8,000 tests, but only about 4,000 people have been tested.
In this case, you can simply use the ratio of official cases to true cases. How do you decide what ratio to use? In the San Francisco Bay Area, they tested everyone who traveled or had contact with a traveler, which means most travel-related cases were caught, but none of the community spread cases. By estimating how widespread community transmission is compared to travel-related transmission, you can estimate how many true cases there are.
I looked at this ratio for South Korea, which publishes excellent statistics. By the time they had 86 cases, 74 of them were caused by community spread — that's 86% (the number 86 isn't special, it's a coincidence).
Using this number, you can calculate the true number of cases. If the San Francisco Bay Area today has 86 confirmed cases, the true number is likely approximately 600.
France: Paris
Today France reports 1,400 cases and 30 deaths. Using the two methods described above, you can get a range for the true number of cases: from 24,000 to 140,000.
The true number of coronavirus cases in France today is likely between 24,000 and 140,000.
Let's pause for a second: the true number of cases in France is likely one to two orders of magnitude higher than officially reported.
Hard to believe? Let's look at the Wuhan chart again.
Source: author's visual analysis and data from the Journal of the American Medical Association
If you add up the orange bars through January 22nd, you get 444 cases; if you add the gray bars, you get approximately 12,000. It turns out that when Wuhan thought it had 444 cases, there were actually 27 times more. If France currently thinks it has 1,400 cases, there could easily be tens of thousands...
The same math applies to Paris. With approximately 30 official cases in the city, the true number is likely in the hundreds, if not thousands. With 300 confirmed cases in the Ile-de-France region, the total number of carriers may already exceed tens of thousands.
Spain: Madrid
Spain's numbers are very close to France's (1,200 detected cases versus 1,400, and 30 deaths in both cases). This means the same rules apply: there are probably already 20,000 infected people in Spain.
In the province of Madrid with its capital of the same name, where official data shows 600 infected and 17 deaths, the true number of cases can be estimated at 10,000 to 60,000.
If you think these numbers can't be real, just consider that Wuhan was already under lockdown with this many cases.
With the number of cases currently in the US, Spain, France, Iran, Germany, Japan, or Switzerland, Wuhan was already locked down.
And if you keep saying that Hubei is just one region, let me remind you that it has a population of nearly 60 million. That's more than Spain, and roughly comparable to France.
2. What Will Happen When This Coronavirus Outbreak Hits?
So, the coronavirus is already here. It's hidden, but growing exponentially.
What will happen in our countries when it hits? This is easy to find out because there are already places where it's happening. The best examples are Hubei and Italy.
Fatality Rate
The World Health Organization (WHO) cites 3.4% as the fatality rate (the proportion of people who contracted the coronavirus and then died). This number is out of context, so let me explain it.
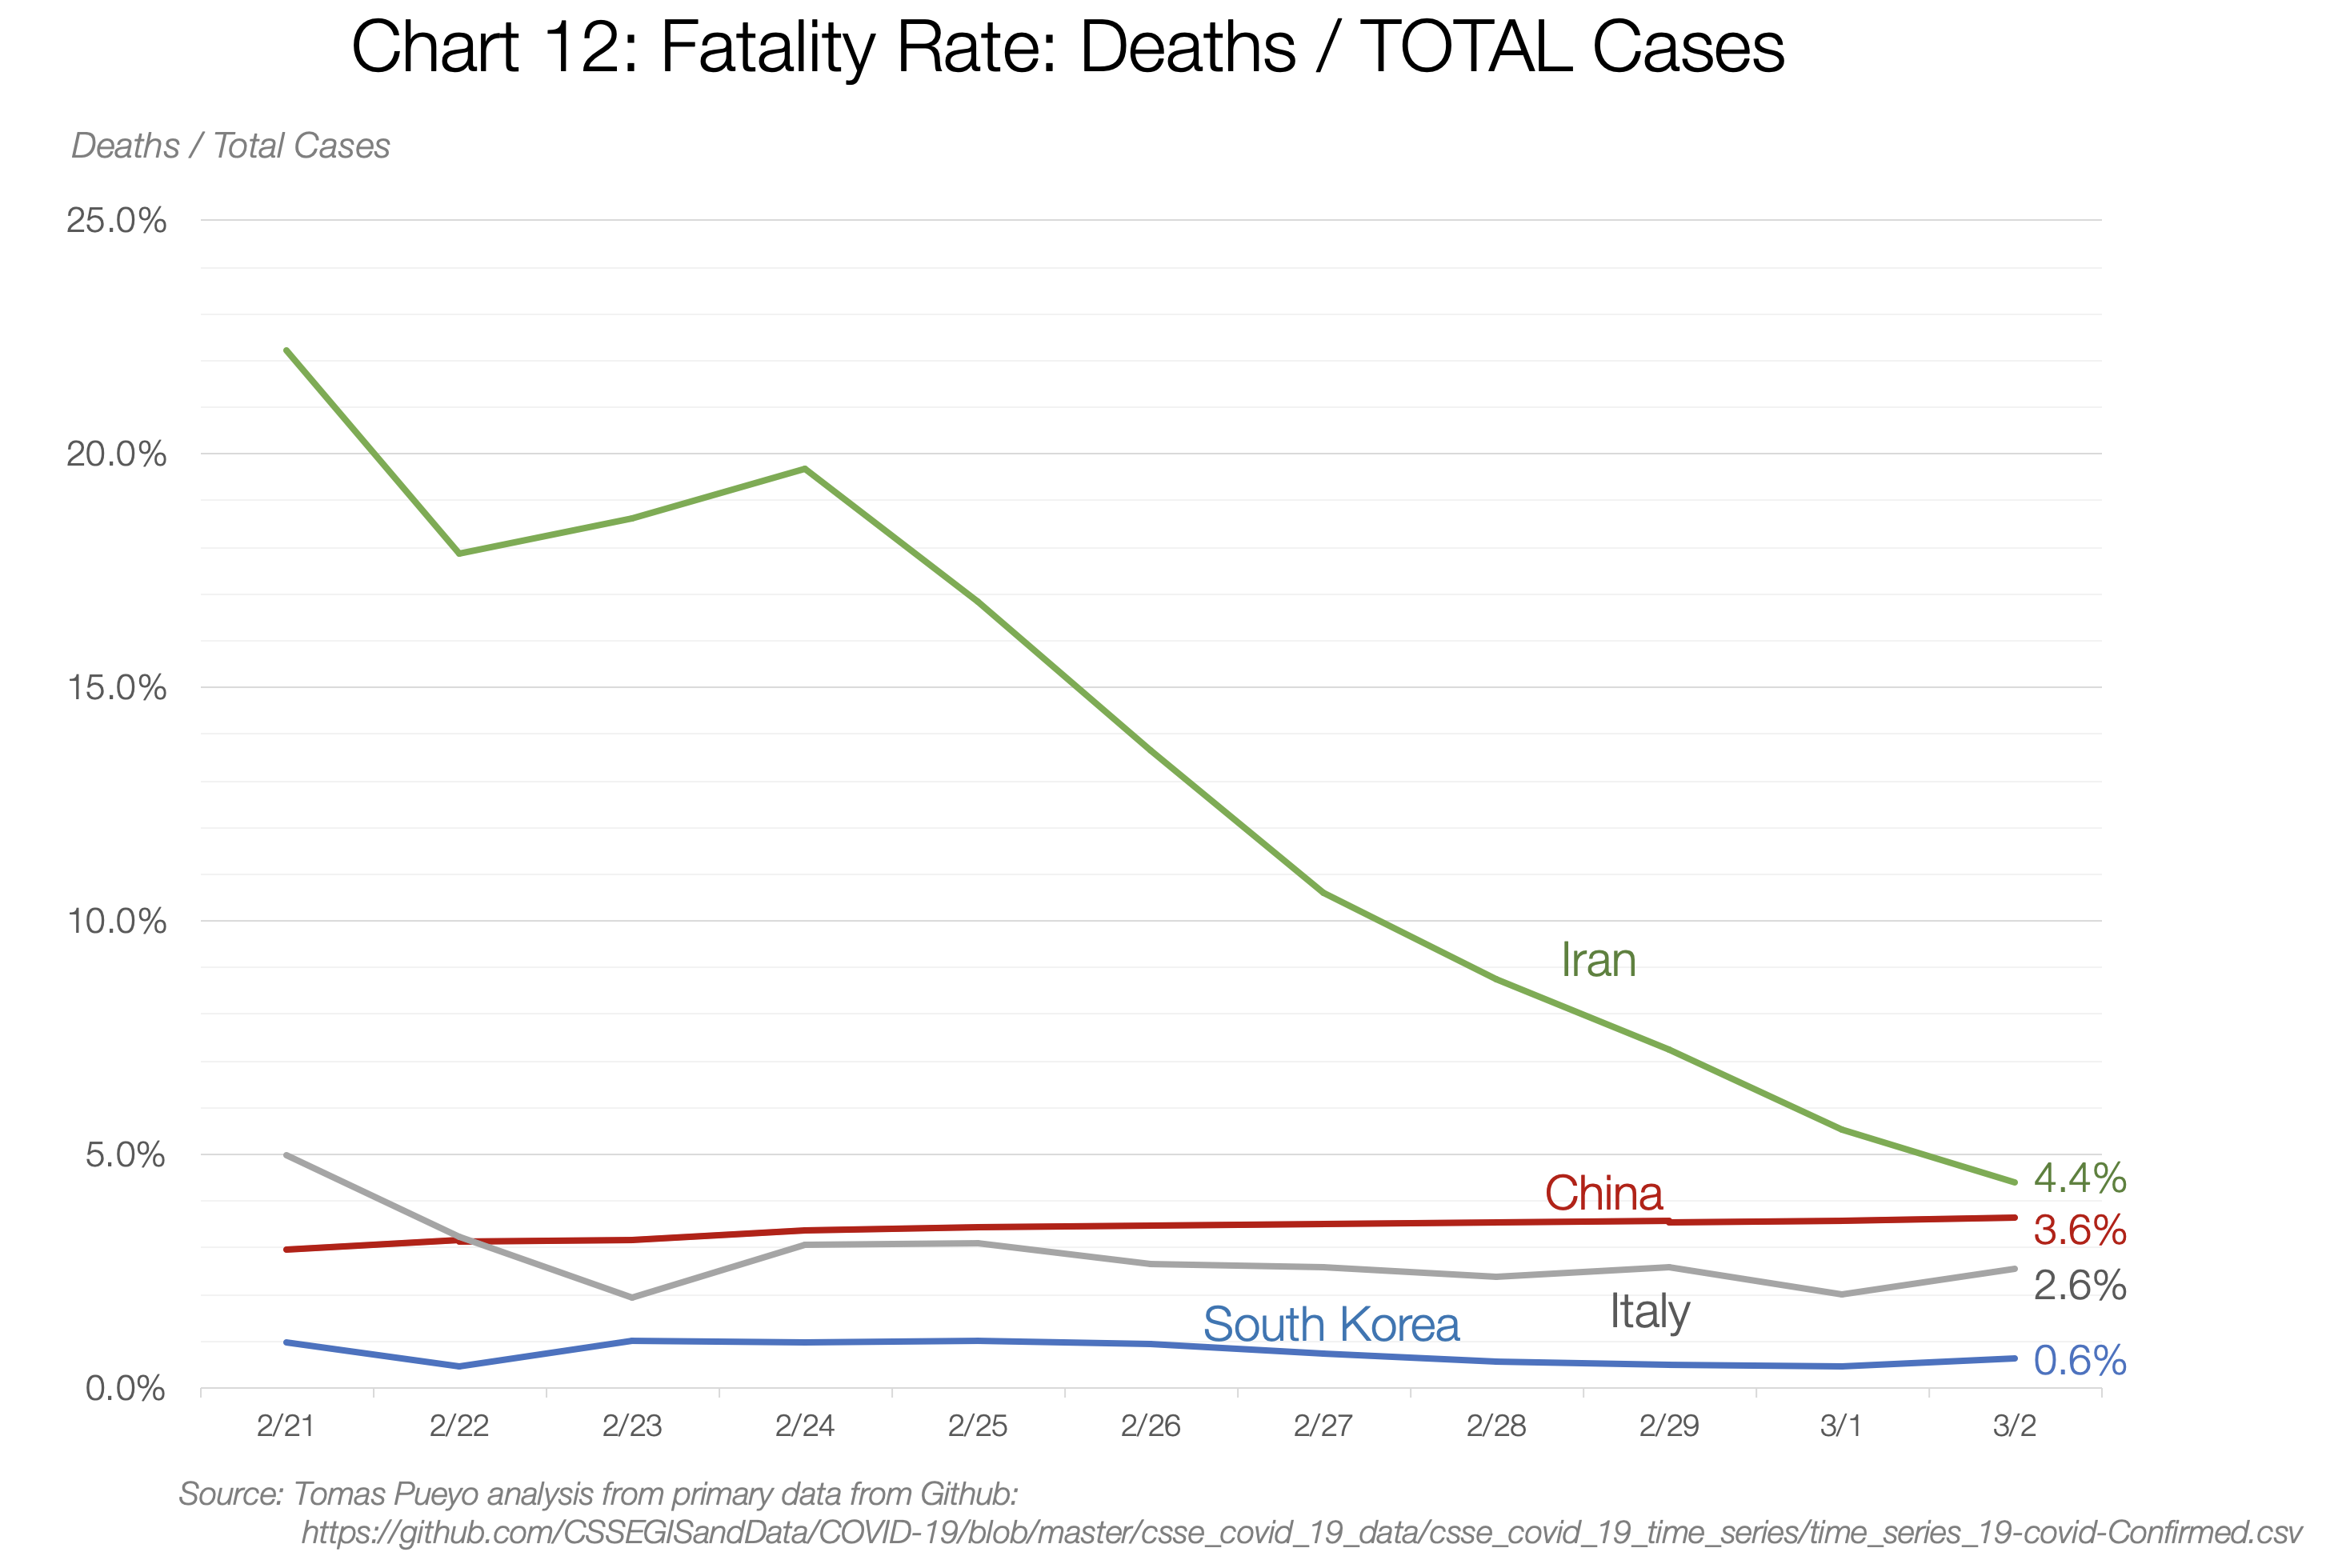
It all depends on the country and timing: from 0.6% in South Korea to 4.4% in Iran. What value should we use? We can use a trick to figure it out.
Two indicators you can rely on to estimate fatality rate are deaths to total cases and deaths to recoveries. The first estimate will likely be too low, because many currently ill patients could still die. The second method overestimates, because death is likely to happen faster than recovery.
The trick is to watch how both indicators change over time. Their values will converge until no patients remain ill, meaning they'll meet at the "deaths to total resolved cases" point — so by extrapolating the observed trends, you can predict the final fatality rate.
Here's what the data shows. In China, the fatality rate is currently between 3.6% and 6.1%. If you project the trends forward, they seem to converge around 3.8%-4%. This is twice the current estimate, and also 30 times worse than the flu.
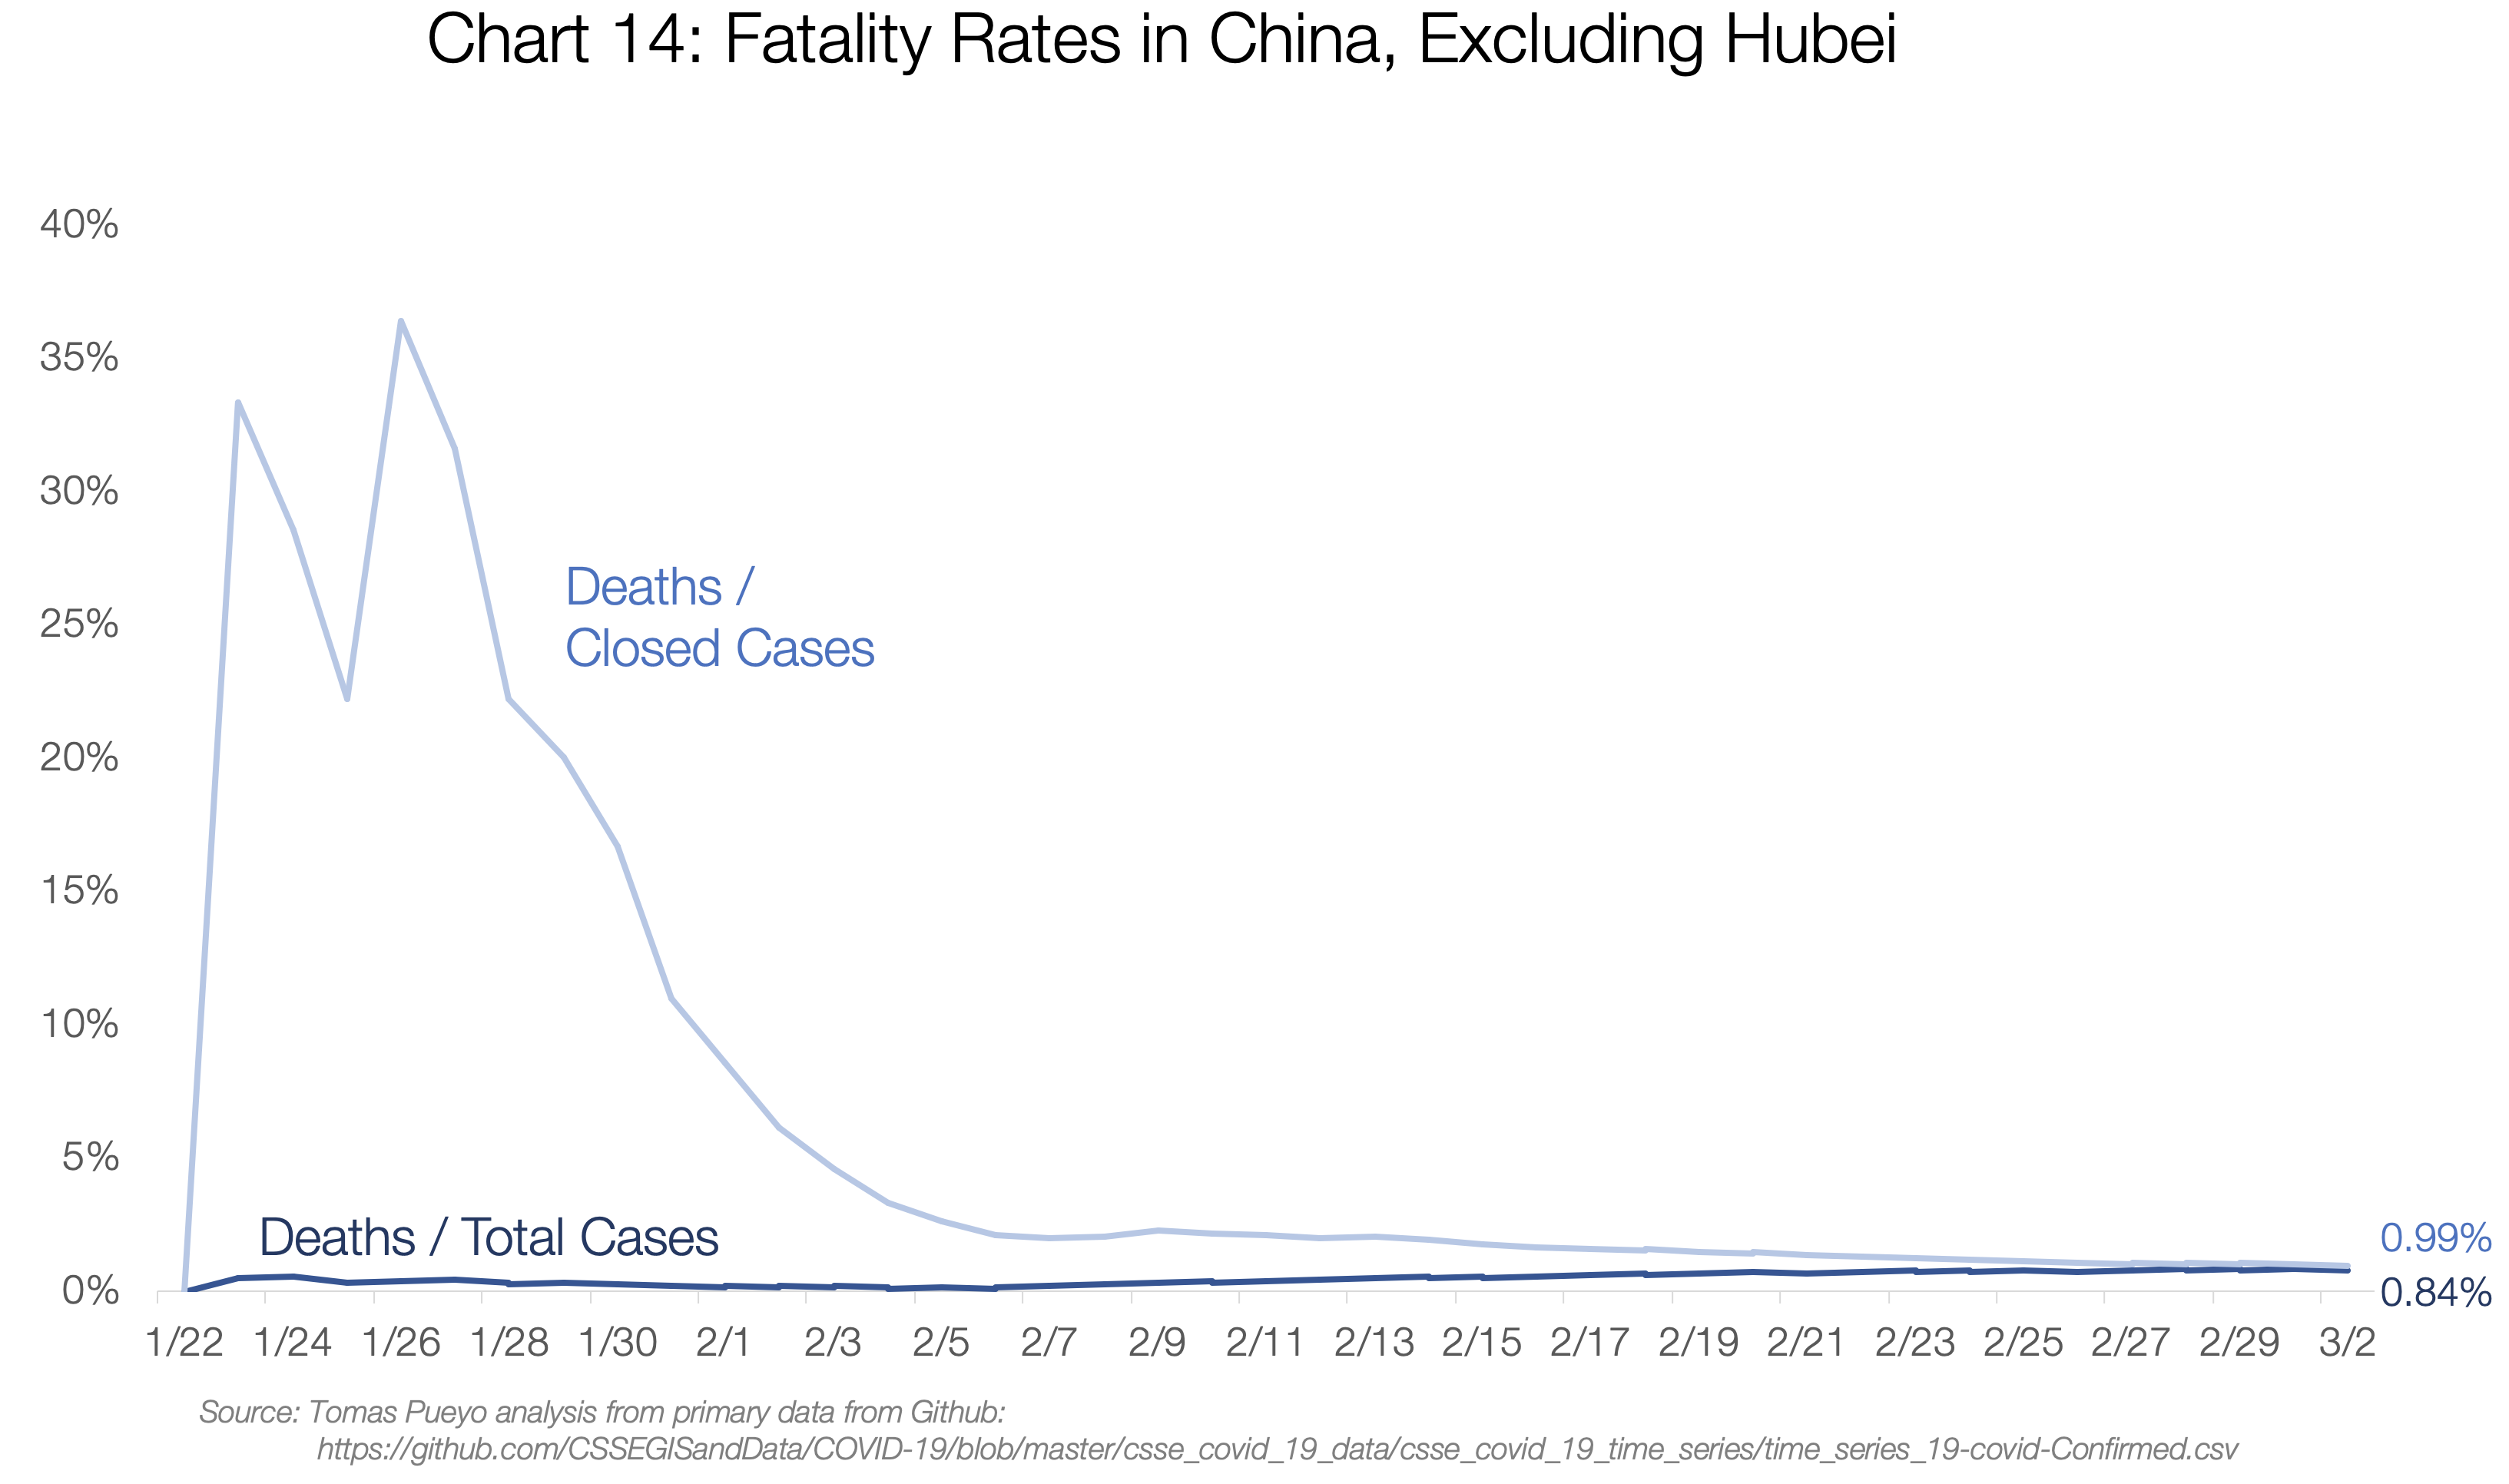
However, we performed calculations on data composed of two completely different realities: Hubei and the rest of China.
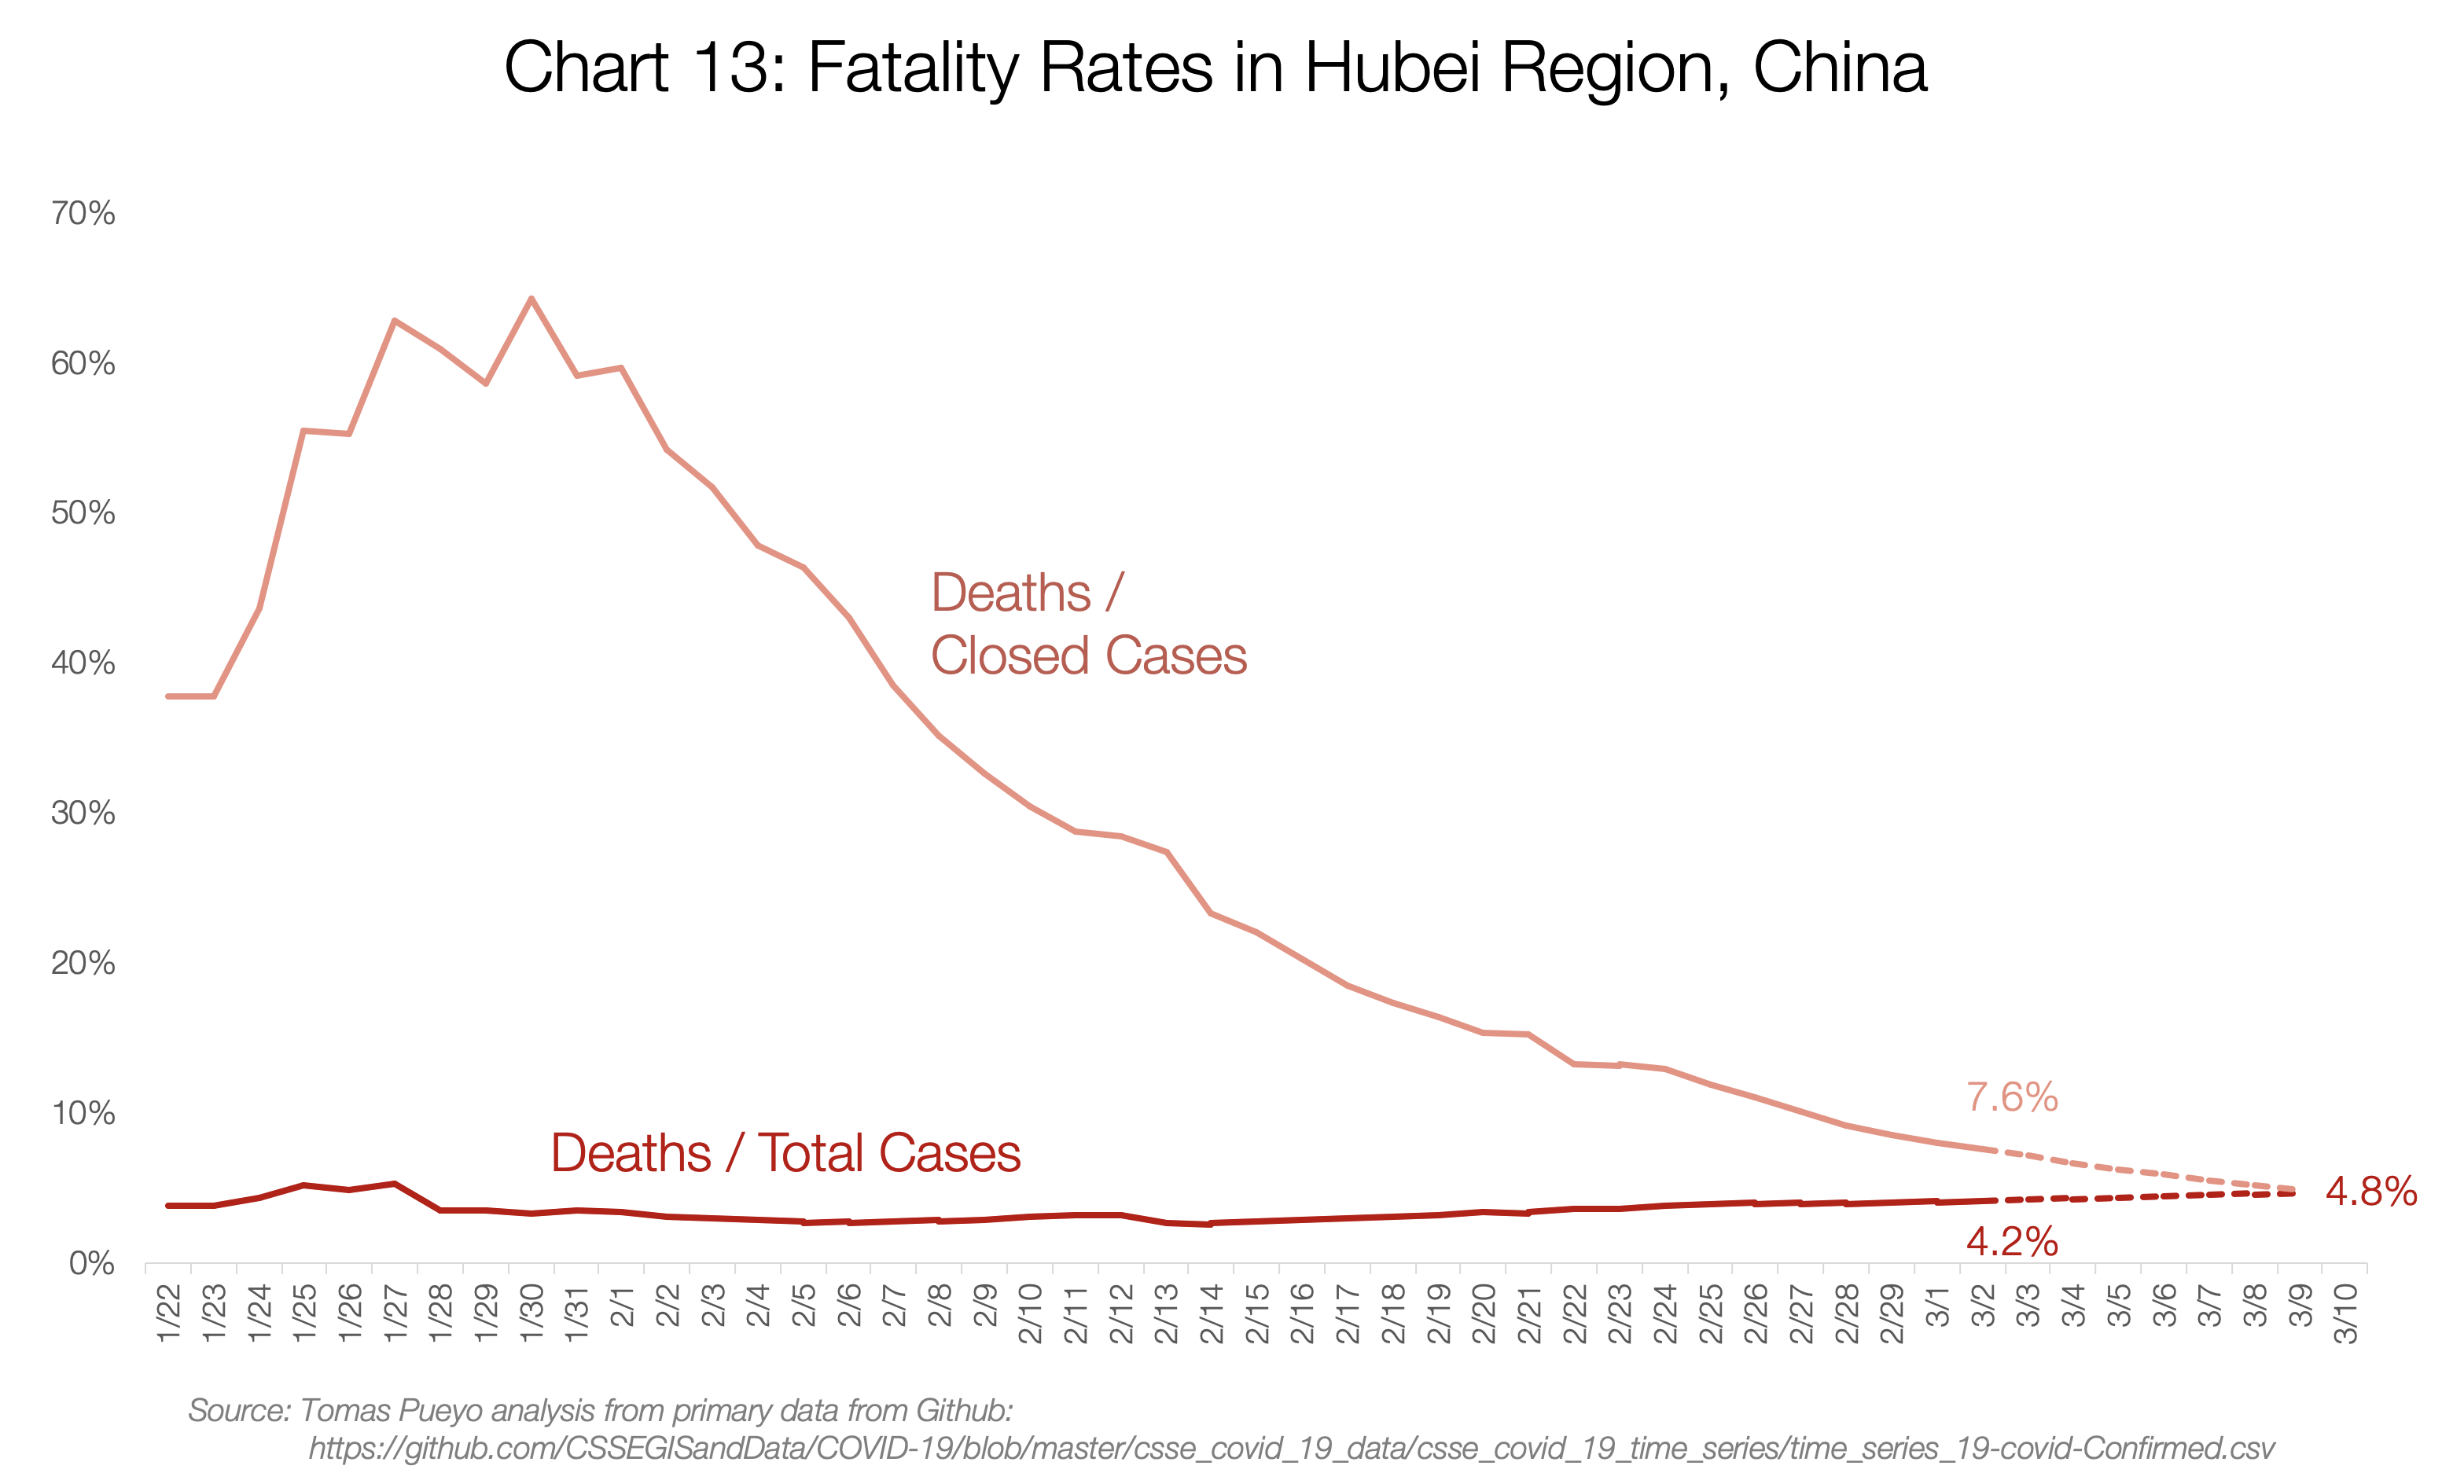
The fatality rate in Hubei will most likely be 4.8%. Meanwhile, for the rest of China, it will likely converge around approximately 0.9%.
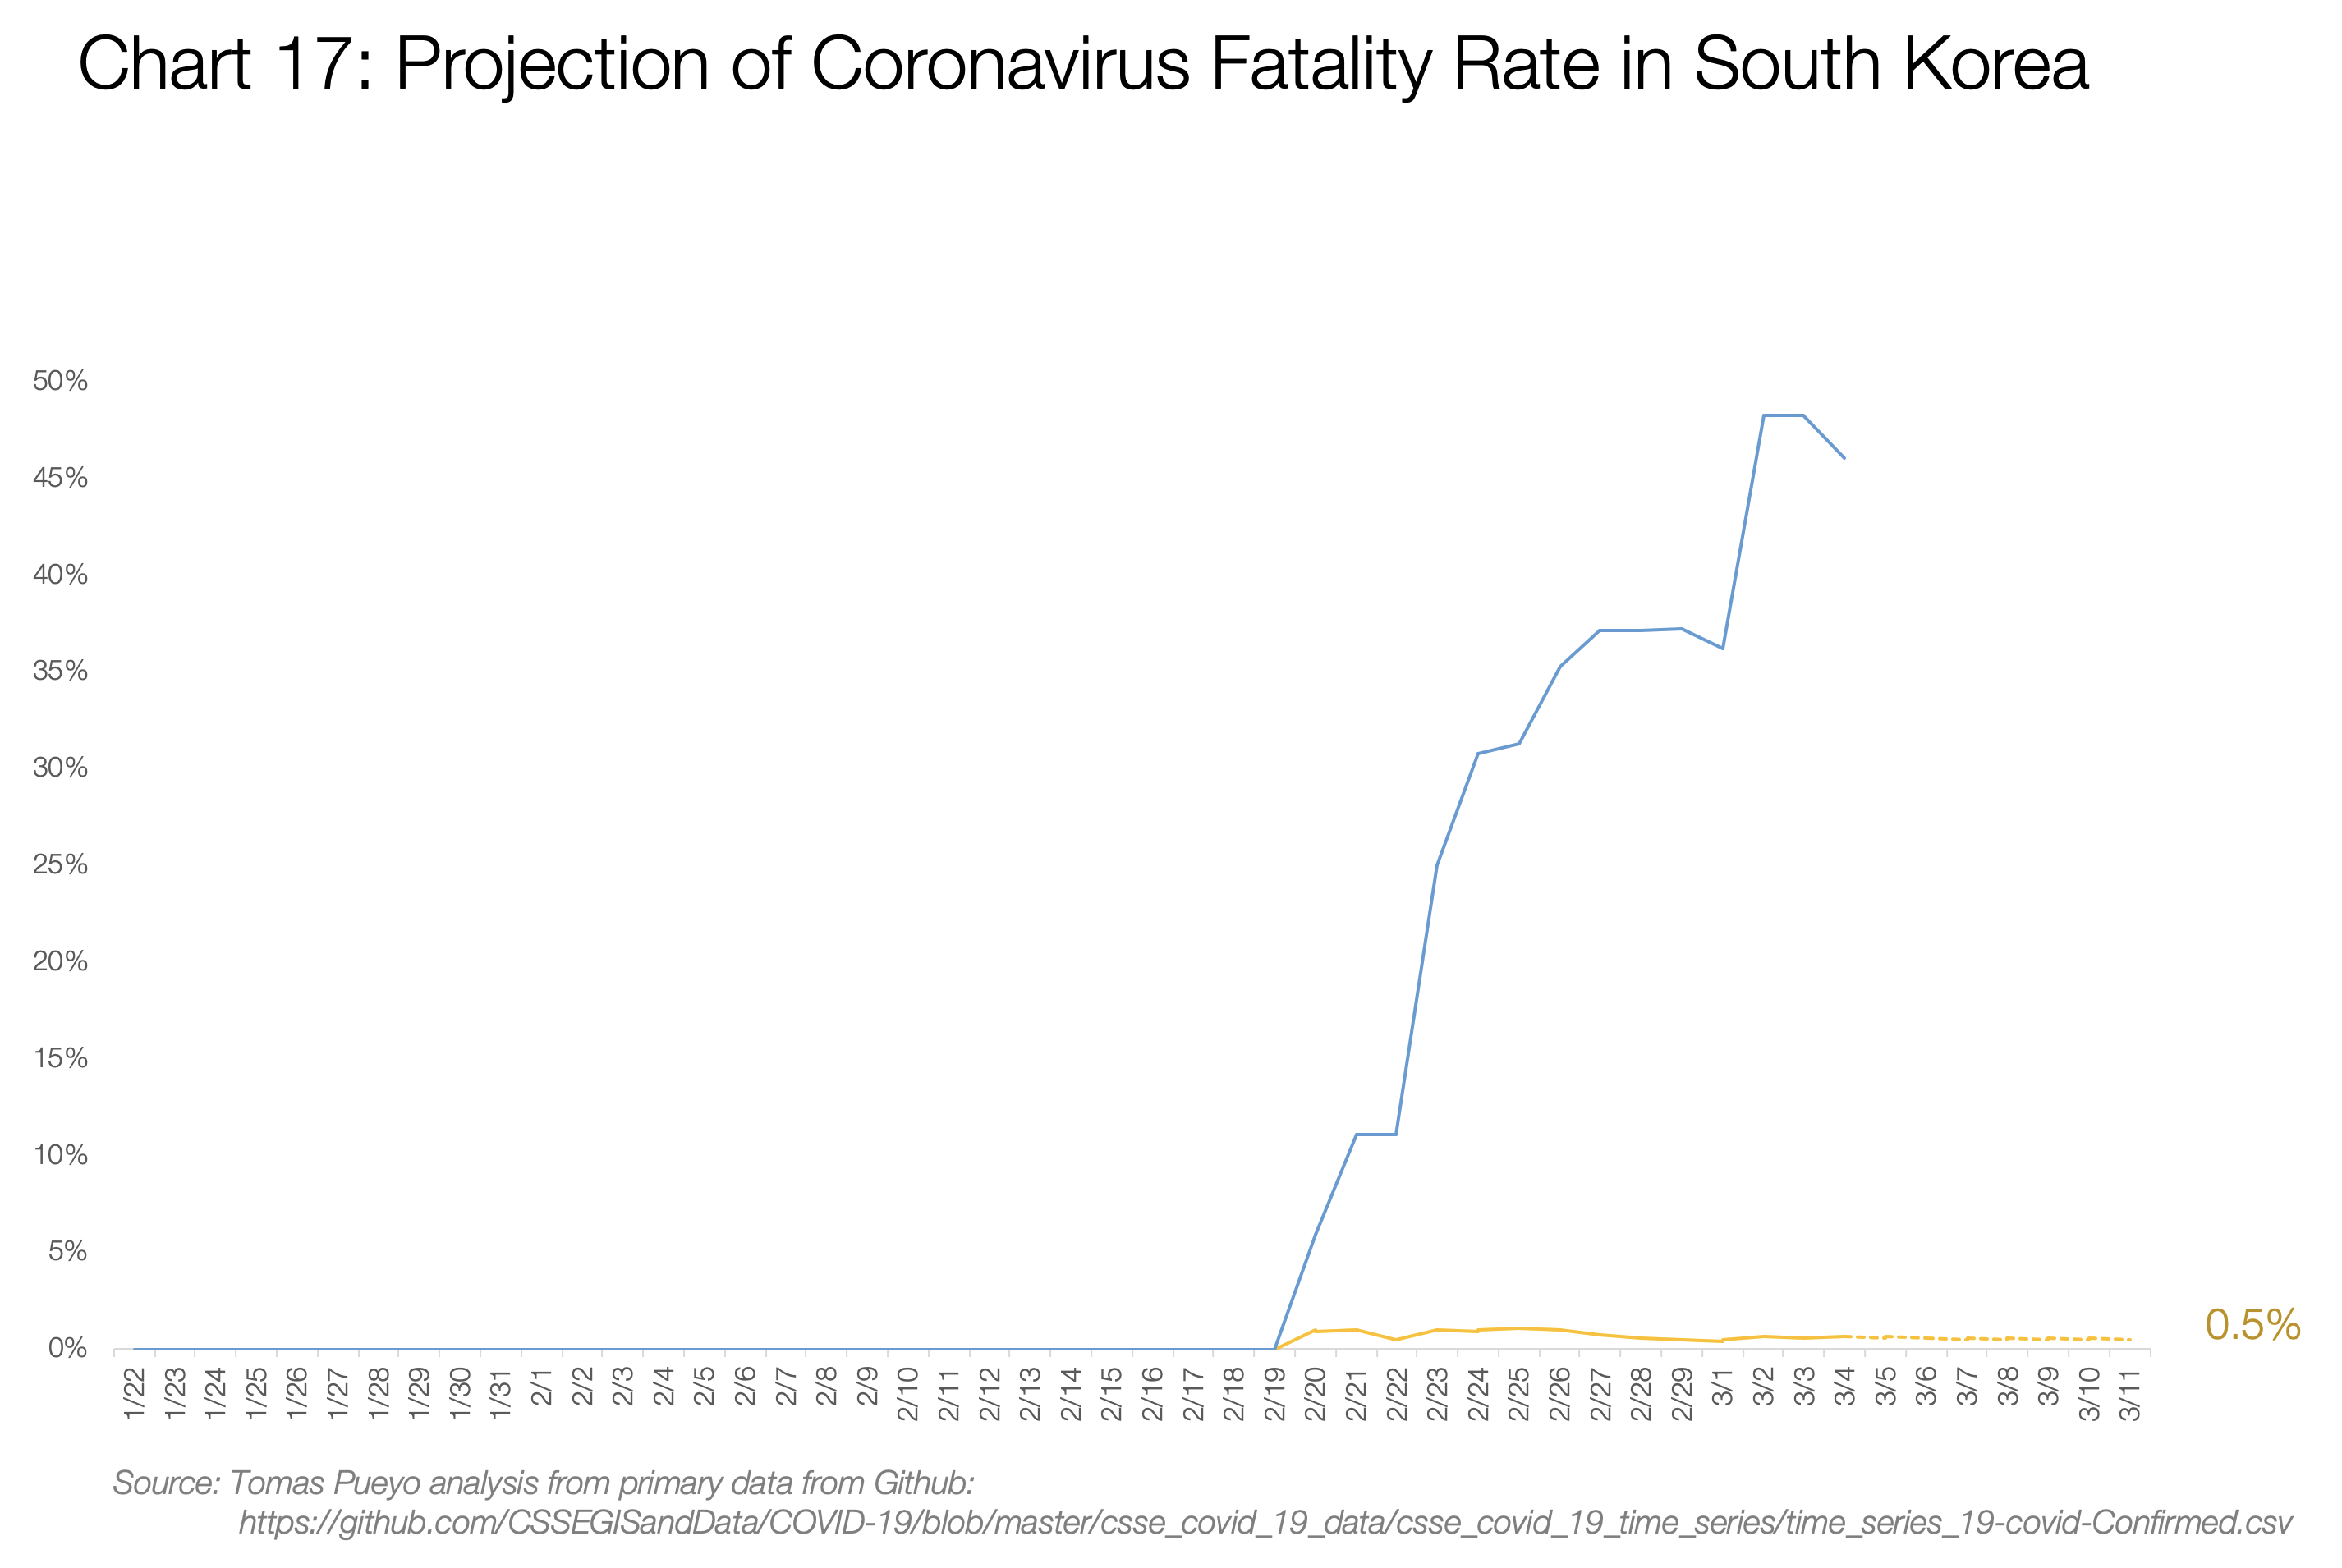
Out of curiosity, it's also worth looking at the charts for Iran, Italy, and South Korea — the few countries where death counts can be considered more or less relevant.
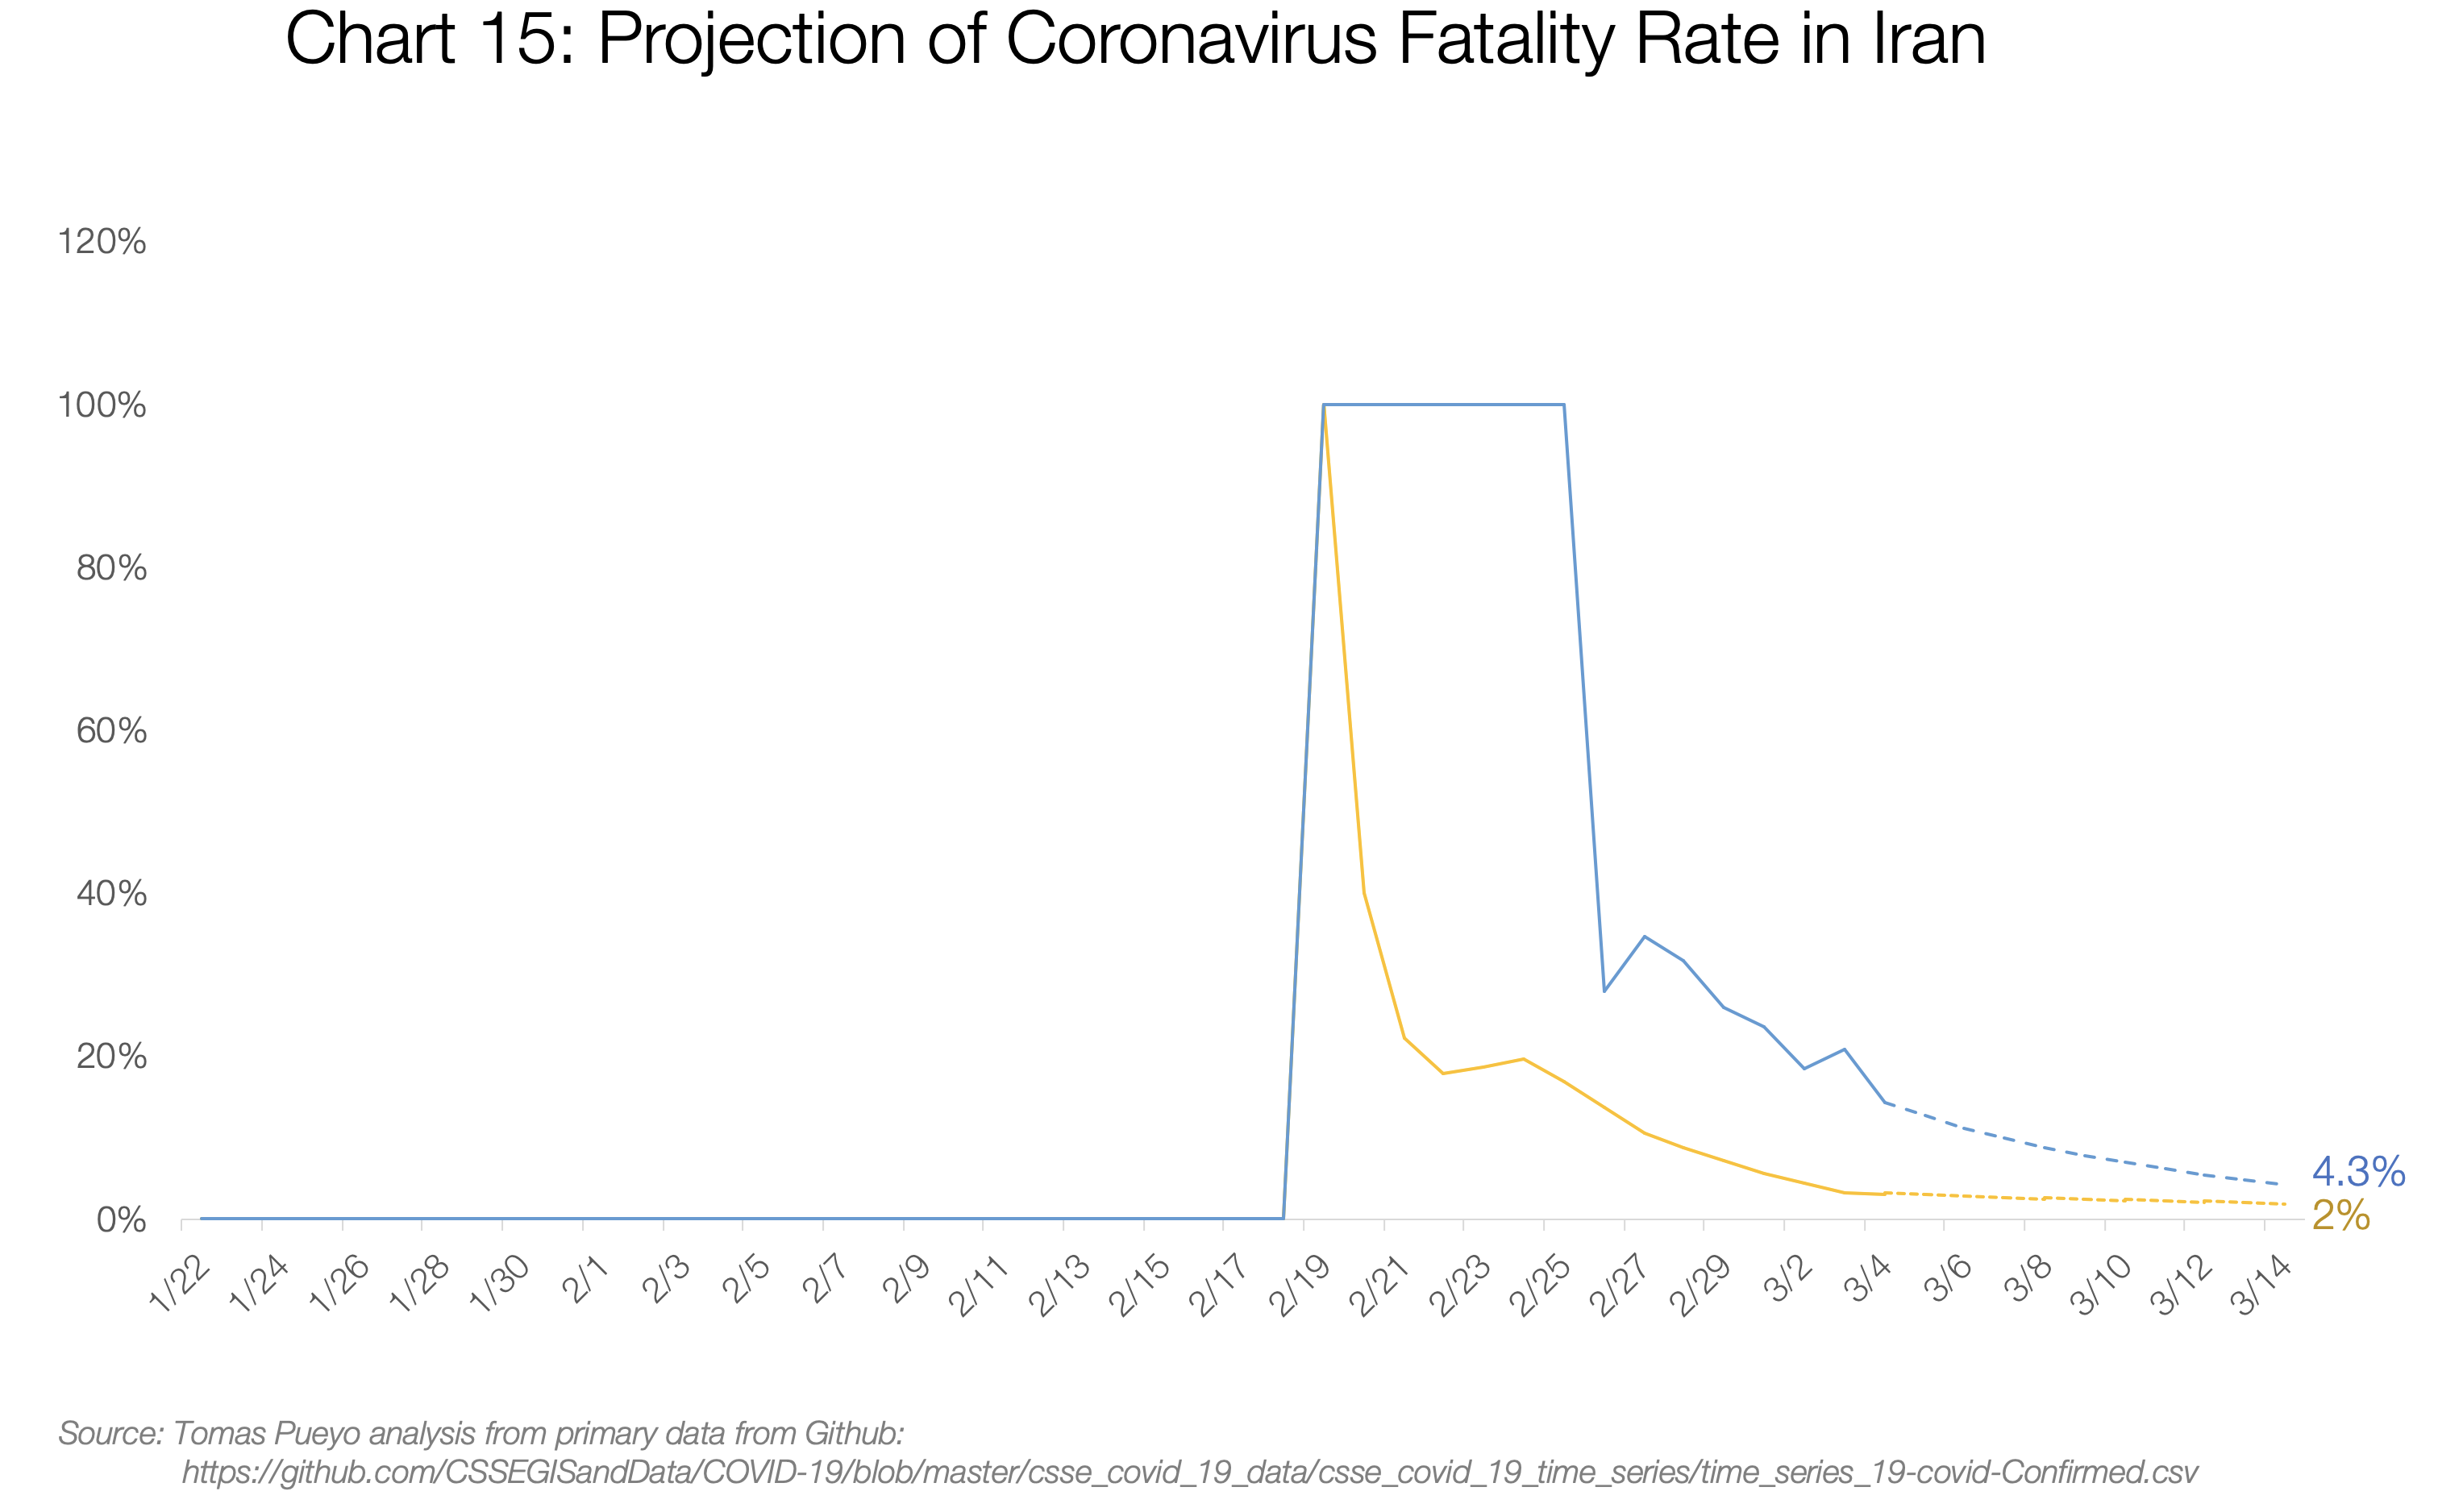
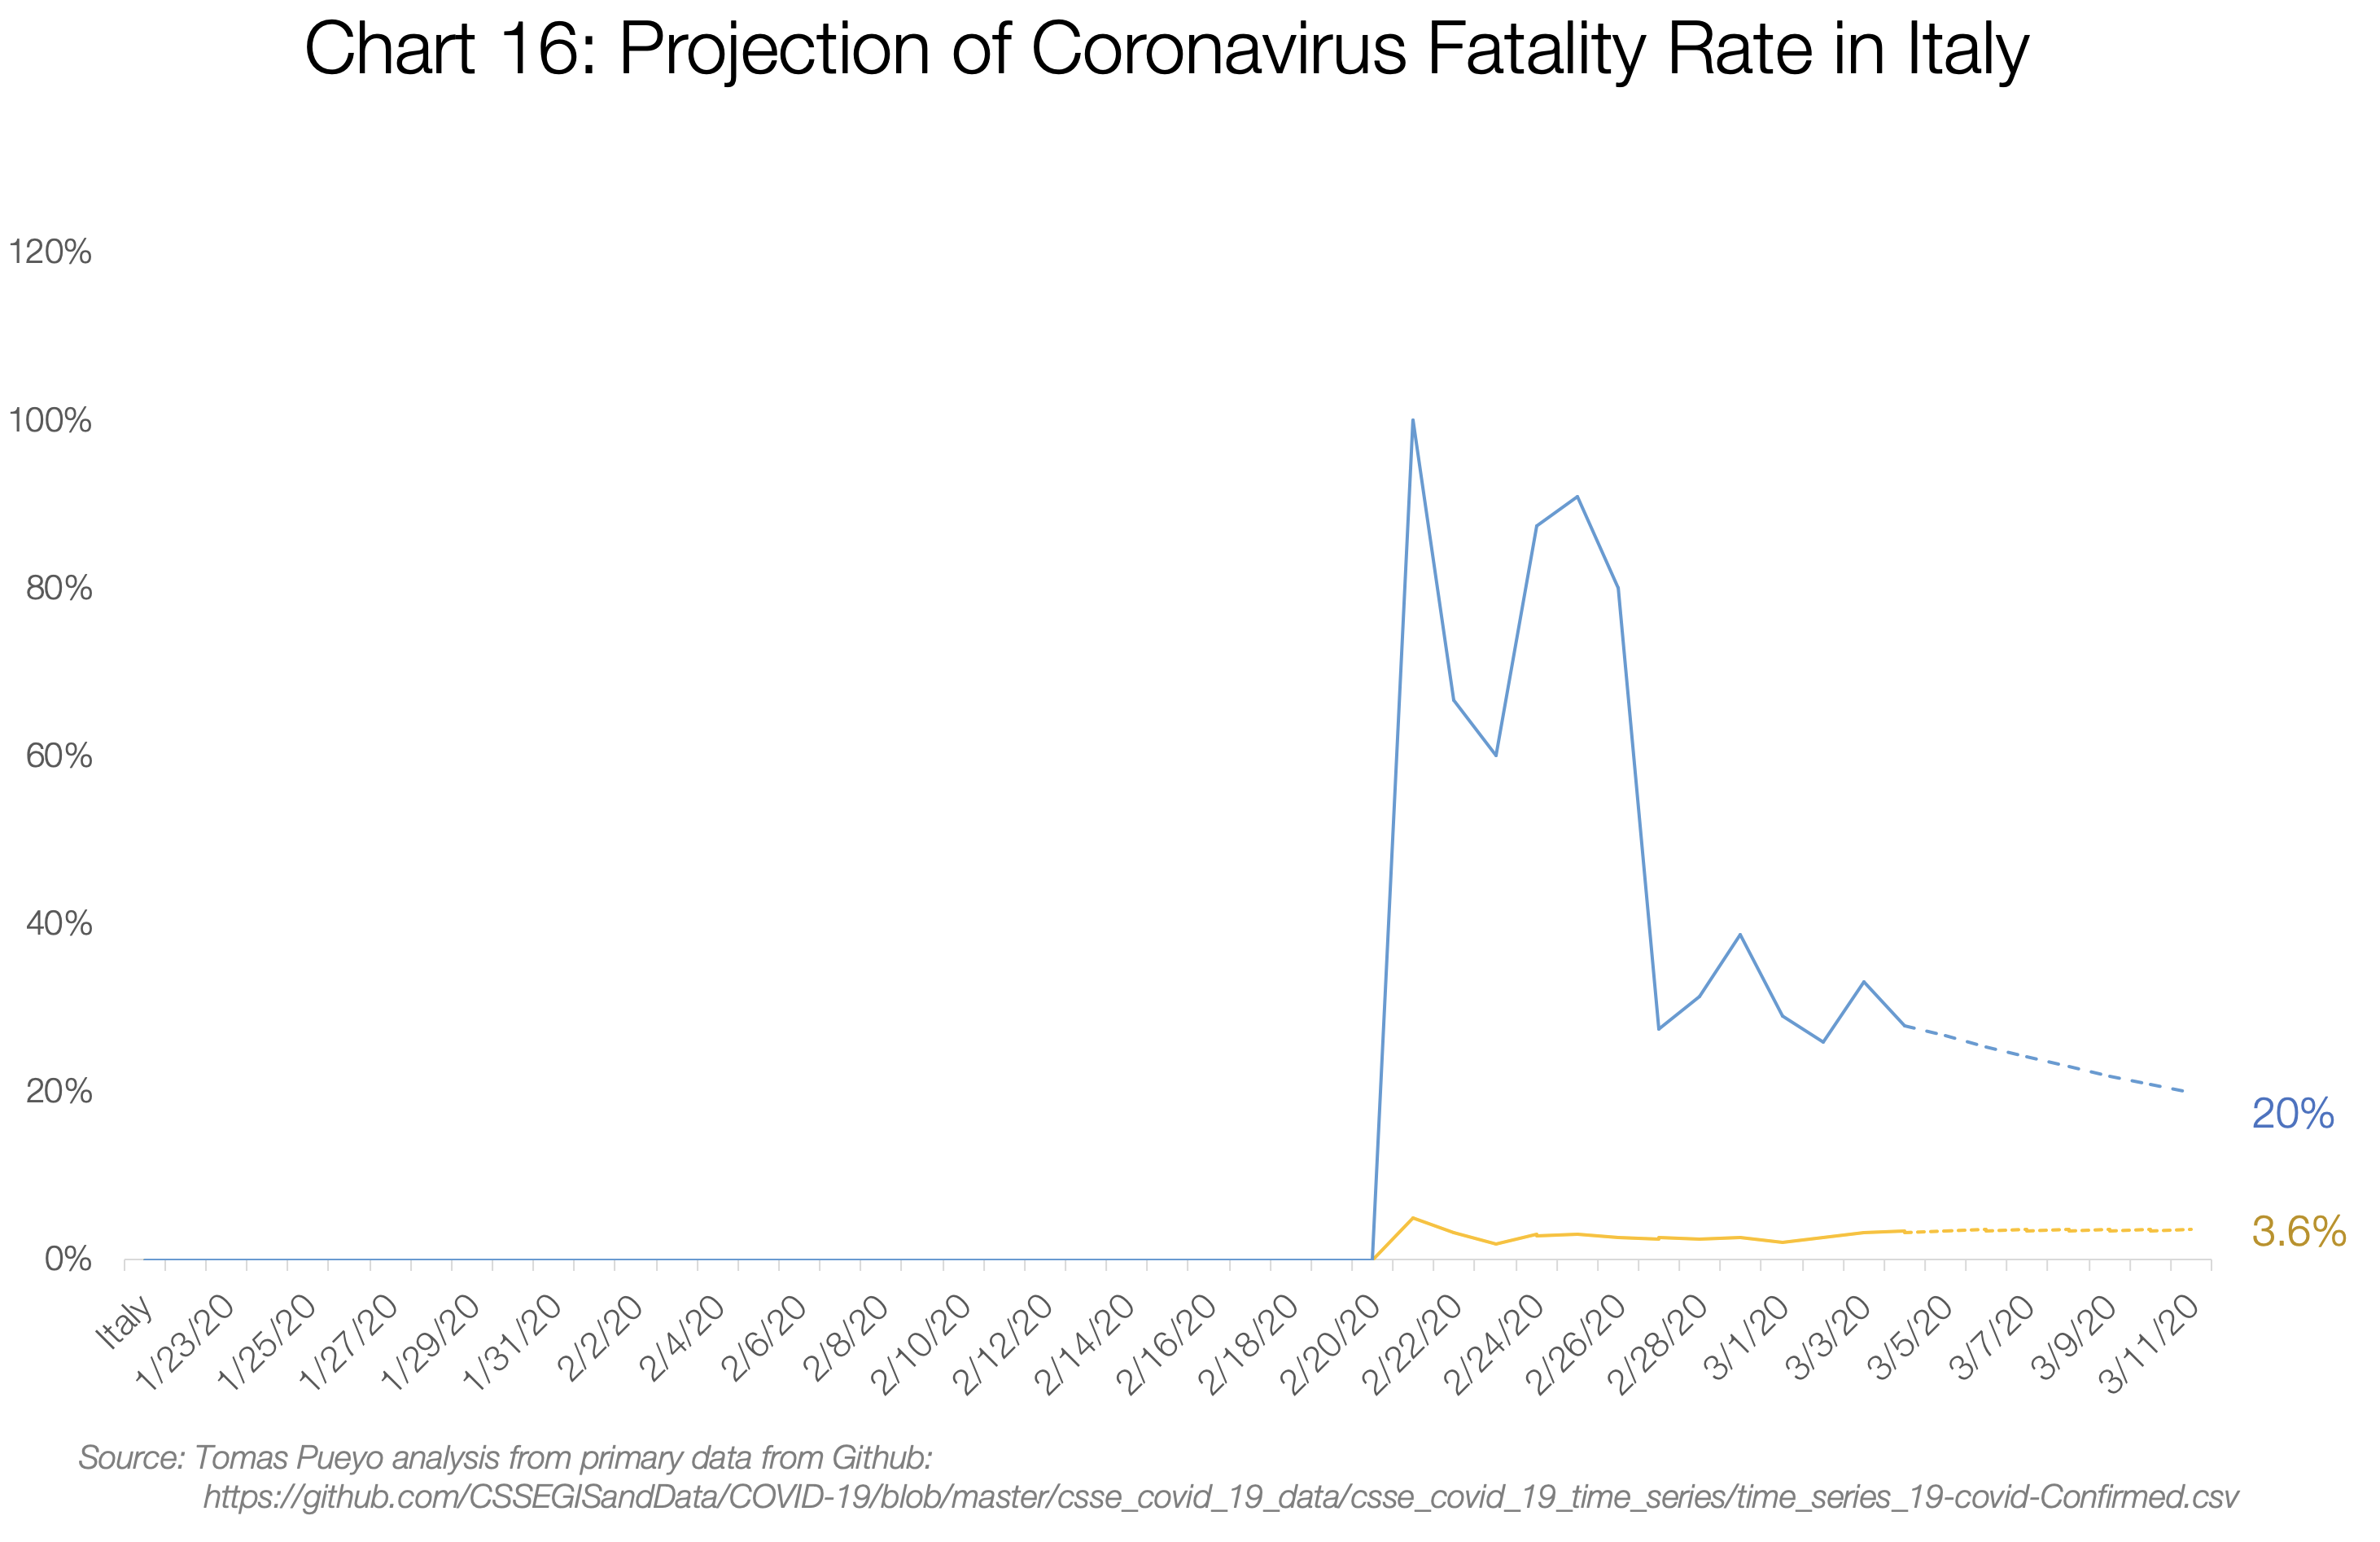
As we can see, in Iran and Italy, fatality rate values converge in the 3%-4% range. We can expect the final figures to be close to this.
South Korea is the most interesting example because its two indicators are completely unrelated: deaths to total cases is only 0.6%, but deaths to recoveries is a staggering 48%. A possible explanation is that the country is simply very cautious. Koreans test everyone (with so many detected cases, the death rate appears low), and they continue monitoring patients for a longer period after recovery (so numbers grow faster when a patient dies). Notably, the ratio of deaths to total cases has been around 0.5% from the very beginning — which suggests it won't change much.
The last relevant example is the cruise ship Diamond Princess: with 706 cases, 6 deaths, and 100 recoveries, the final fatality rate will be in the range of 1% to 6.5%.
From this, we can conclude:
- In countries prepared for the epidemic, the fatality rate will be from approximately 0.5% (South Korea) to 0.9% (rest of China).
- In overwhelmed and unprepared countries, the fatality rate will be approximately 3%-5%.
In other words, countries that act quickly can reduce deaths tenfold. And this is only counting deaths — quick response also dramatically reduces the number of affected people, which in itself simplifies the task.
Countries that act quickly reduce deaths by at least 10x.
So what does a country need to be prepared?
Healthcare System Load
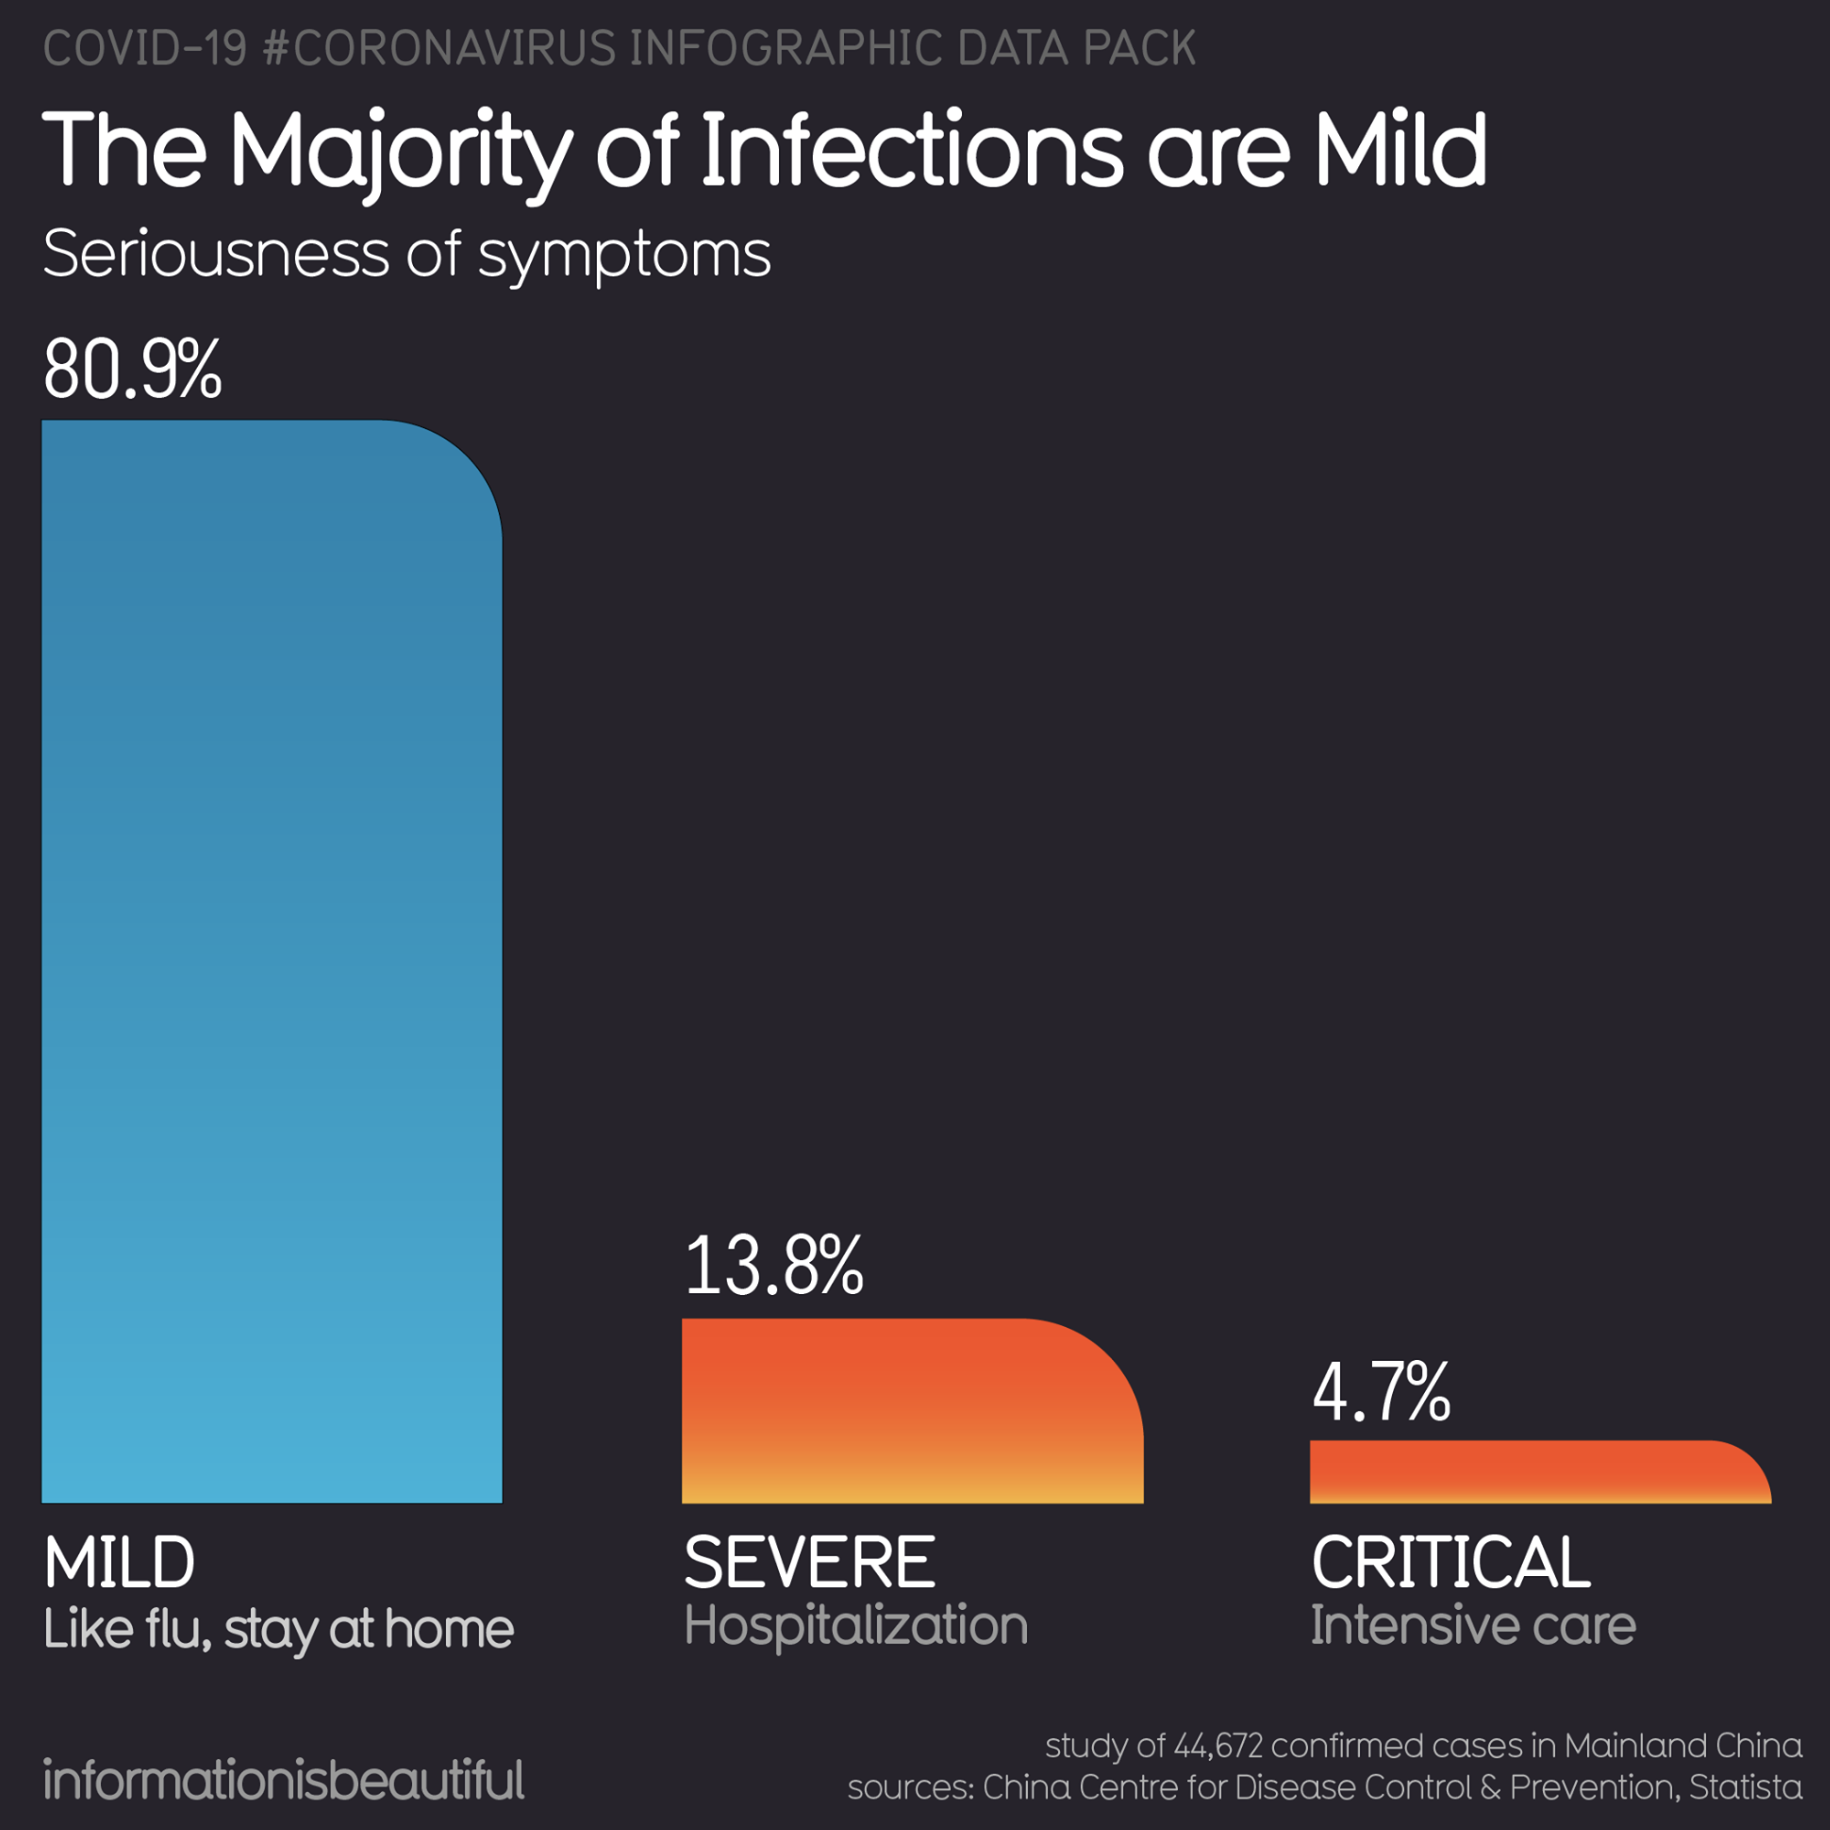
About 20% of coronavirus cases require hospitalization, 5% require intensive care units (ICU), and about 1% require extremely intensive care with equipment like ventilators or ECMO (artificial heart and lungs).
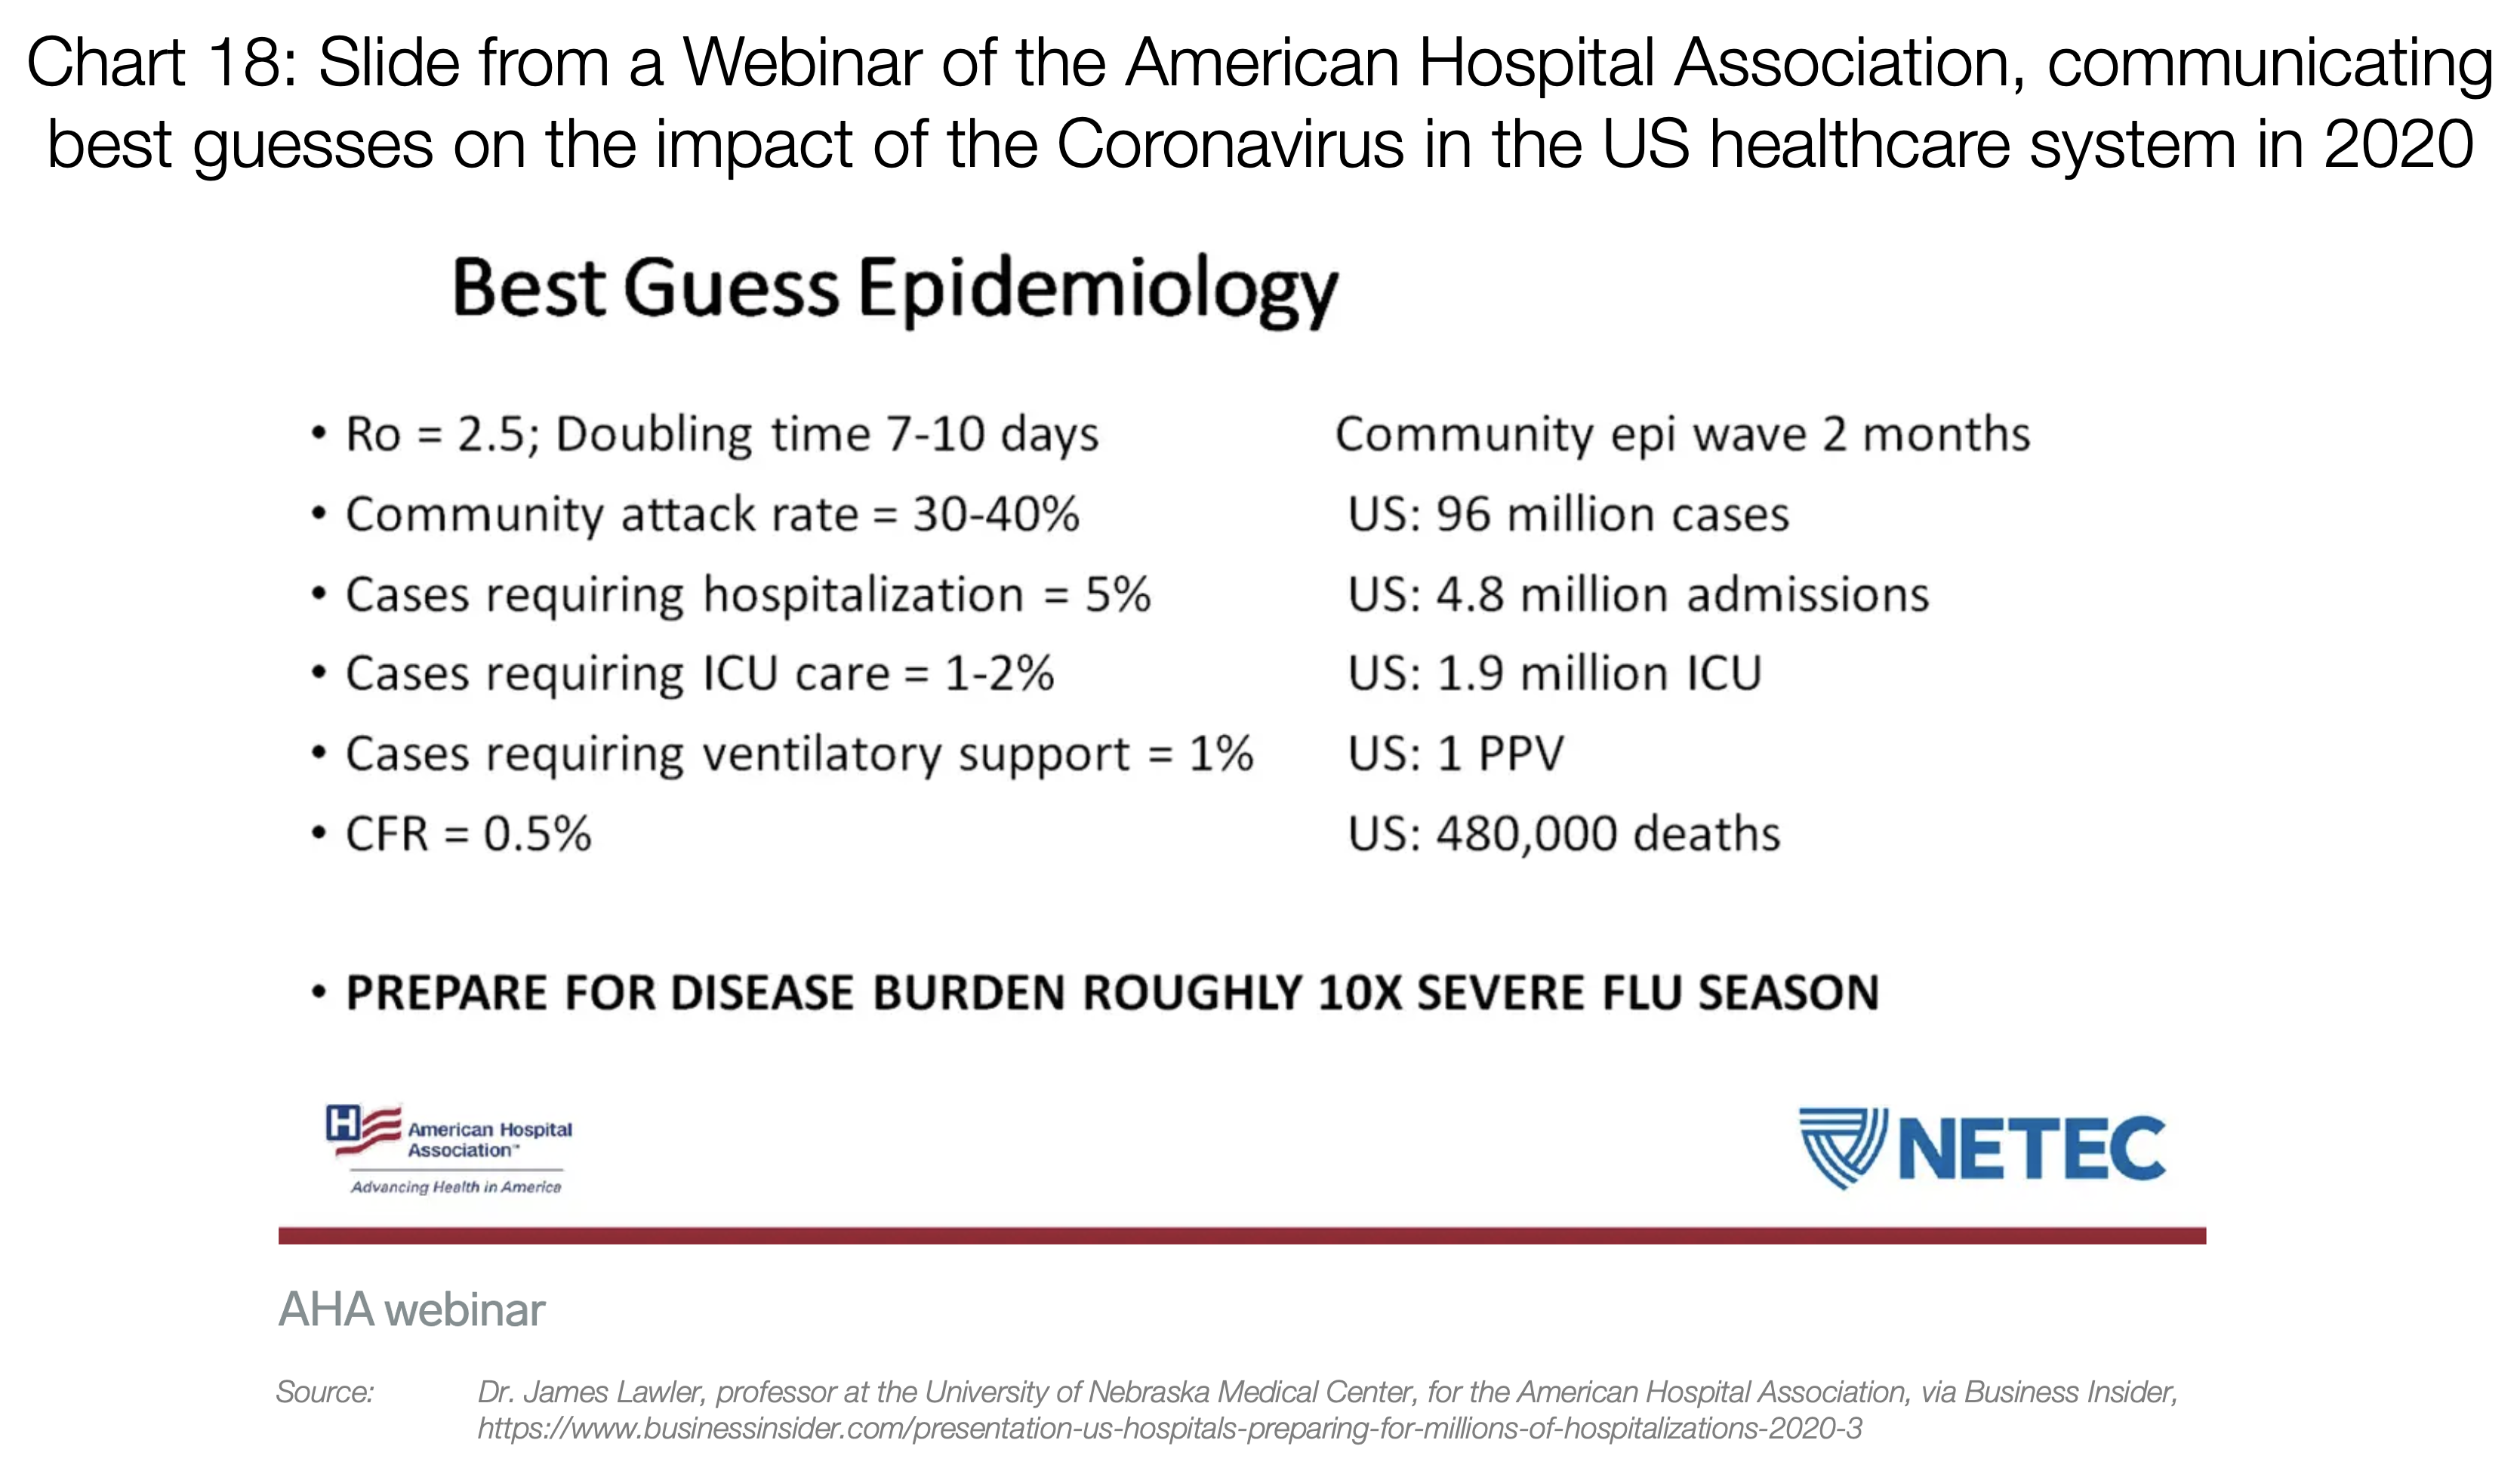
The problem is that equipment like ventilators and ECMO machines cannot be easily manufactured or purchased. A few years ago, for example, the US had only 250 ECMO machines.
So if suddenly 100,000 people get infected, many of them will want to be tested. About 20,000 will need hospitalization, 5,000 will need intensive care, and 1,000 will need equipment that is already in short supply. And that's just 100,000 cases.
This doesn't even account for other problems — like masks. A country like the US has only 1% of the masks needed for healthcare workers (12 million N95 and 30 million surgical masks versus the required 3.5 billion). If many cases appear simultaneously, masks will last only two weeks.
Countries like Japan, South Korea, Hong Kong, or Singapore, as well as Chinese regions outside Hubei, were prepared and able to provide patients with necessary care.
But the rest of the Western countries are heading more in the direction of Hubei and Italy. So what's happening there?
How an Overwhelmed Healthcare System Works
The stories from Hubei and Italy are starting to eerily resemble each other. Although Hubei managed to build two hospitals in ten days, they were immediately completely overwhelmed.
In both places, everyone complained that patients were flooding hospitals. They had to be cared for everywhere: in hallways, in waiting rooms...
This short Twitter thread paints a rather terrifying picture of today's Italy.
Healthcare workers go hours without changing protective clothing because there isn't enough. As a result, they can't leave contaminated zones for hours at a time. When they finally do, they collapse, dehydrated and exhausted. Shifts no longer exist. Retired professionals have to be called back to meet staffing needs, and people unfamiliar with nursing are overnight trained to fill critical roles. There are no days off or rest hours — everyone works without breaks.
That is, until they get sick. Which happens often, because they are in constant contact with the virus without adequate protective gear. When it happens, they must quarantine for 14 days, during which they can't help anyone. In the best case, they lose two weeks; in the worst case, they're dead.
The most horrible thing happens in the ICU, when patients have to share ventilators or ECMO machines. They simply cannot be shared, so healthcare workers must determine which patient will use them. Which, in reality, means deciding who lives and who dies.
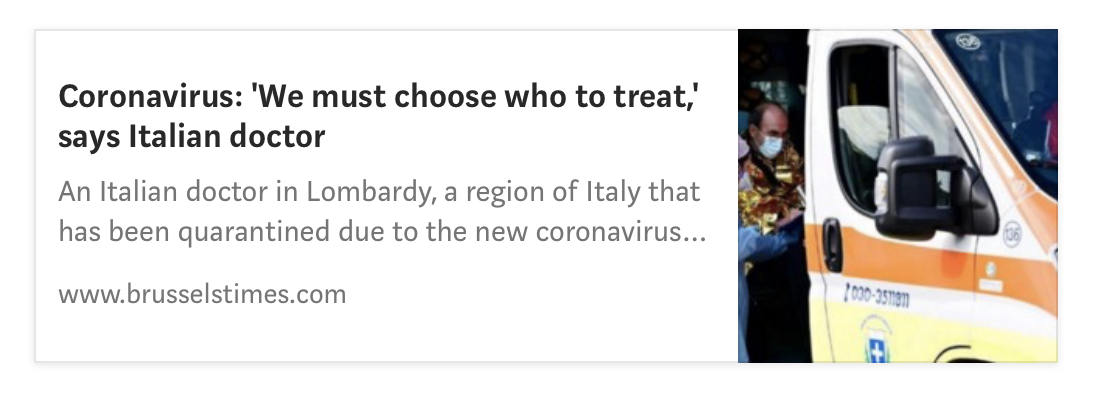
"After a few days, you have to choose. [...] Not everyone can be intubated. We make the decision based on age and health condition" — Cristian Salaroli, Italian doctor
All of this leads to a fatality rate in an overwhelmed healthcare system of approximately 4% instead of approximately 0.5%. If you want your city or your country to be part of that 4%, just do nothing today.
3. What Should Be Done?
Flatten the Curve
This is now a pandemic, and it can't simply be eliminated. But what we can do is reduce its impact.
Some countries can serve as role models. The best example is Taiwan, which is very closely connected to China and yet has fewer than 50 cases to date. This recent paper explains all the measures they took early on, which were aimed at containment.
They managed to contain the spread, but most countries couldn't. Now Taiwan is busy with something else — mitigation. They're trying to make the disease as harmless as possible.
If we minimize the number of infections as much as possible, our healthcare system will be much better able to handle the cases, leading to lower fatality rates. And if we maintain this approach long enough, we'll reach a point where the rest of society can be vaccinated, completely eliminating the risk. So our goal isn't to eliminate coronavirus infection — it's to delay it.
The longer we delay infections, the better the healthcare system functions, the lower the fatality rate, and the higher the proportion of the population that will be vaccinated before they get infected.
So how do we flatten the curve?
Social Distancing
There is one very simple thing we can do that definitely works: social distancing.
Going back to the Wuhan chart, you can recall that as soon as the city imposed a lockdown, the epidemic declined. The reason is that people weren't interacting with each other, and the coronavirus wasn't spreading.
Current scientific consensus states that this virus is transmitted within a 2-meter radius if someone coughs. Otherwise, the droplets fall to the ground and don't infect anyone.
The next route of infection is through direct contact: the virus survives for hours or days on various surfaces. If it behaves like the flu, it can survive on metal, ceramic, and plastic for weeks. This means things like door handles, tables, or elevator buttons can be terrible vectors of infection.
The only effective countermeasure is social distancing. People need to be kept at home as long as possible until the outbreak subsides. This was already proven in the past, specifically during the 1918 flu pandemic.
Lessons from the 1918 Flu Pandemic
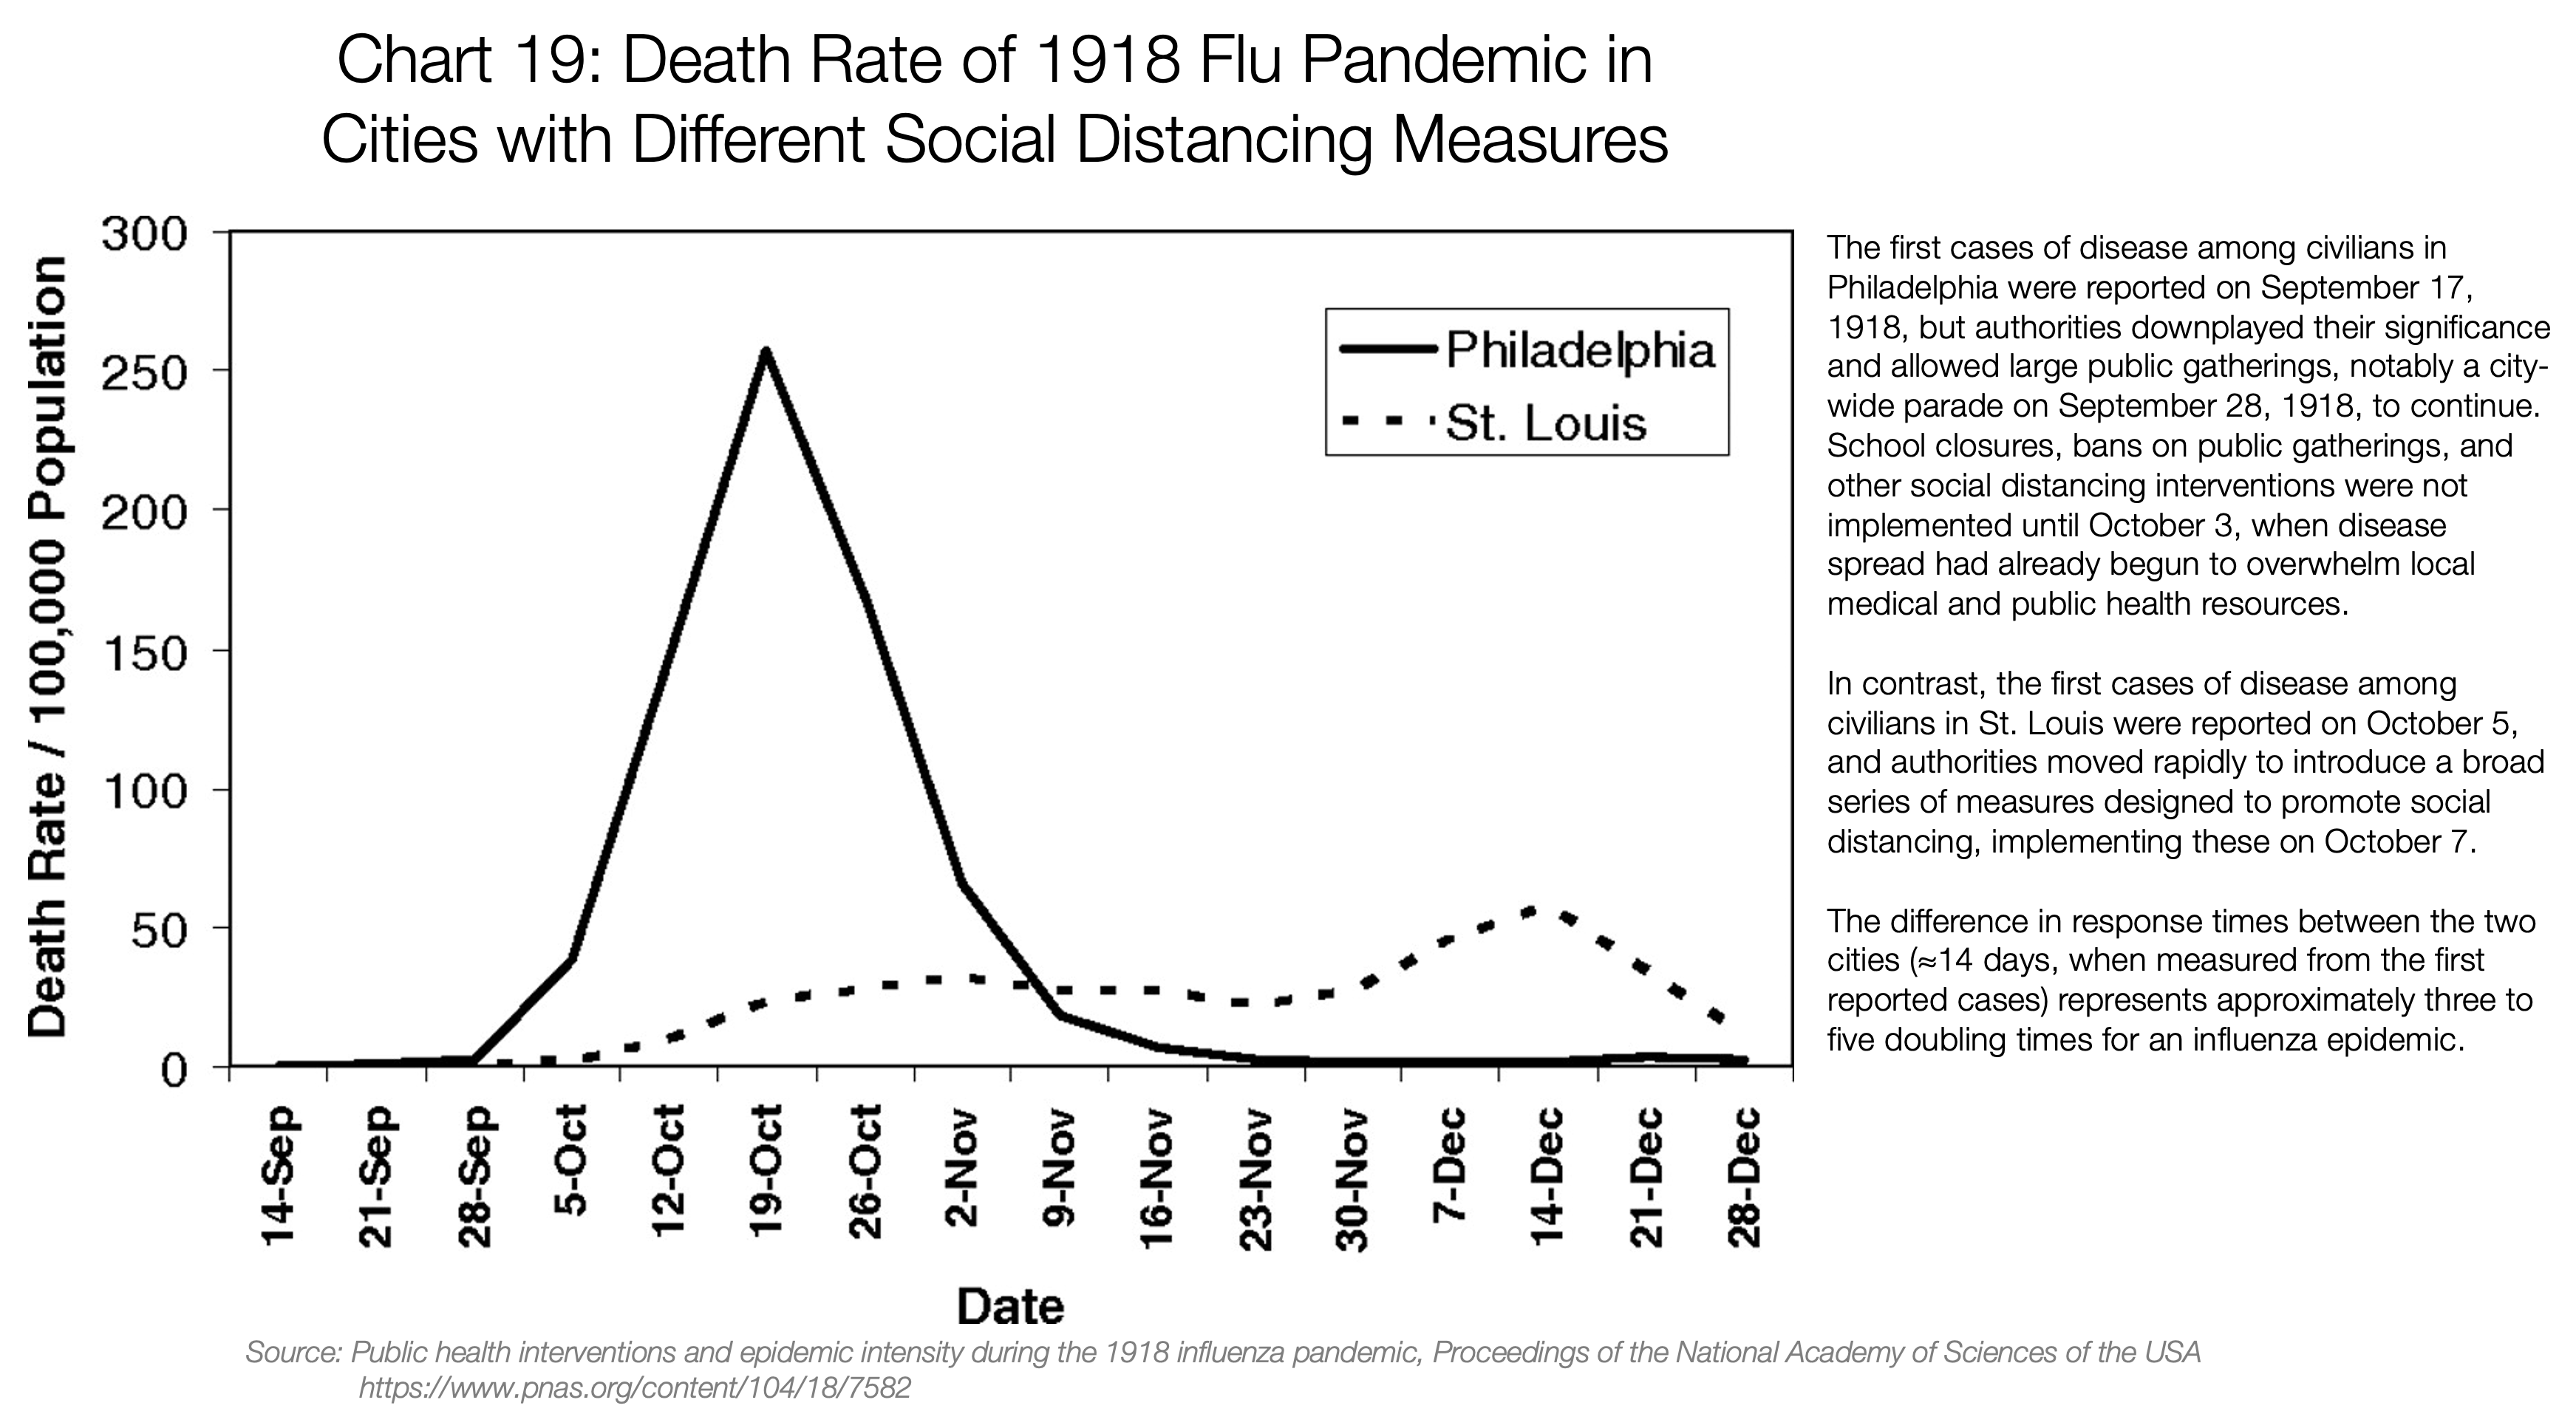
You can see how Philadelphia (solid line) didn't act quickly and had a massive peak in deaths. Compare this with St. Louis (dashed line), which did everything right.
Then look at Denver (below), which took the necessary measures but then relaxed them. They had a double peak, the second even higher than the first.
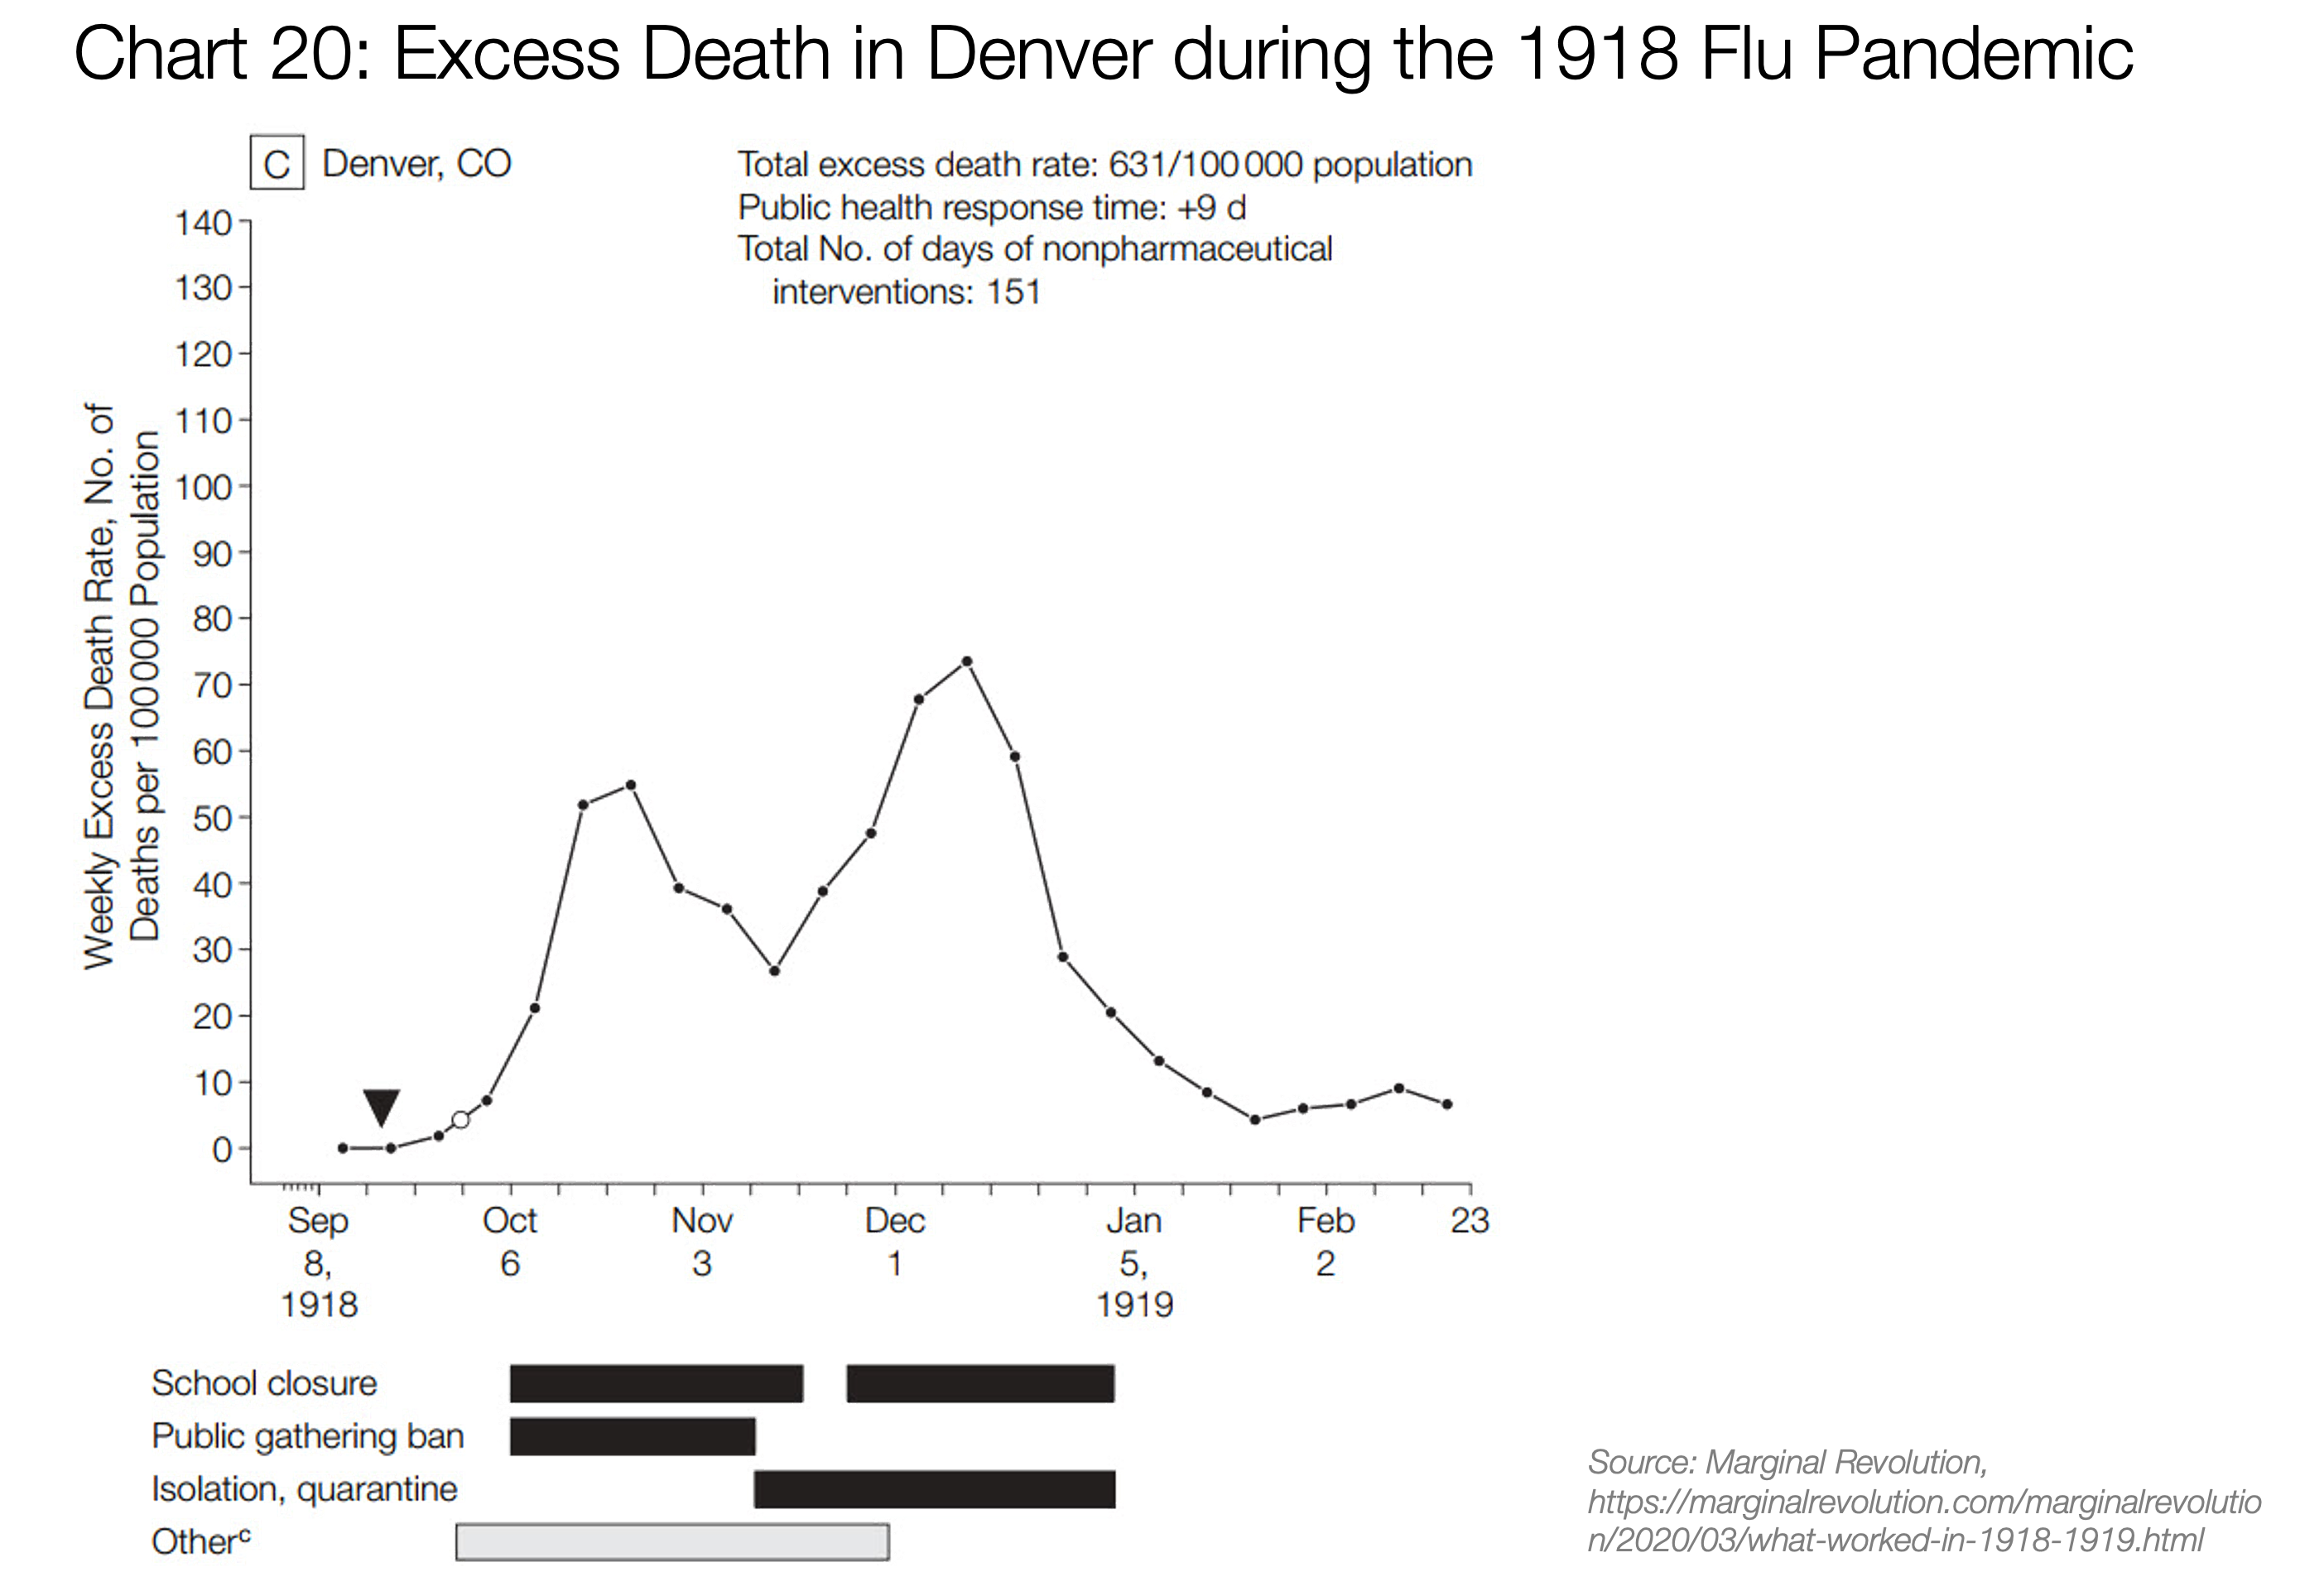
To generalize, here's what you get:
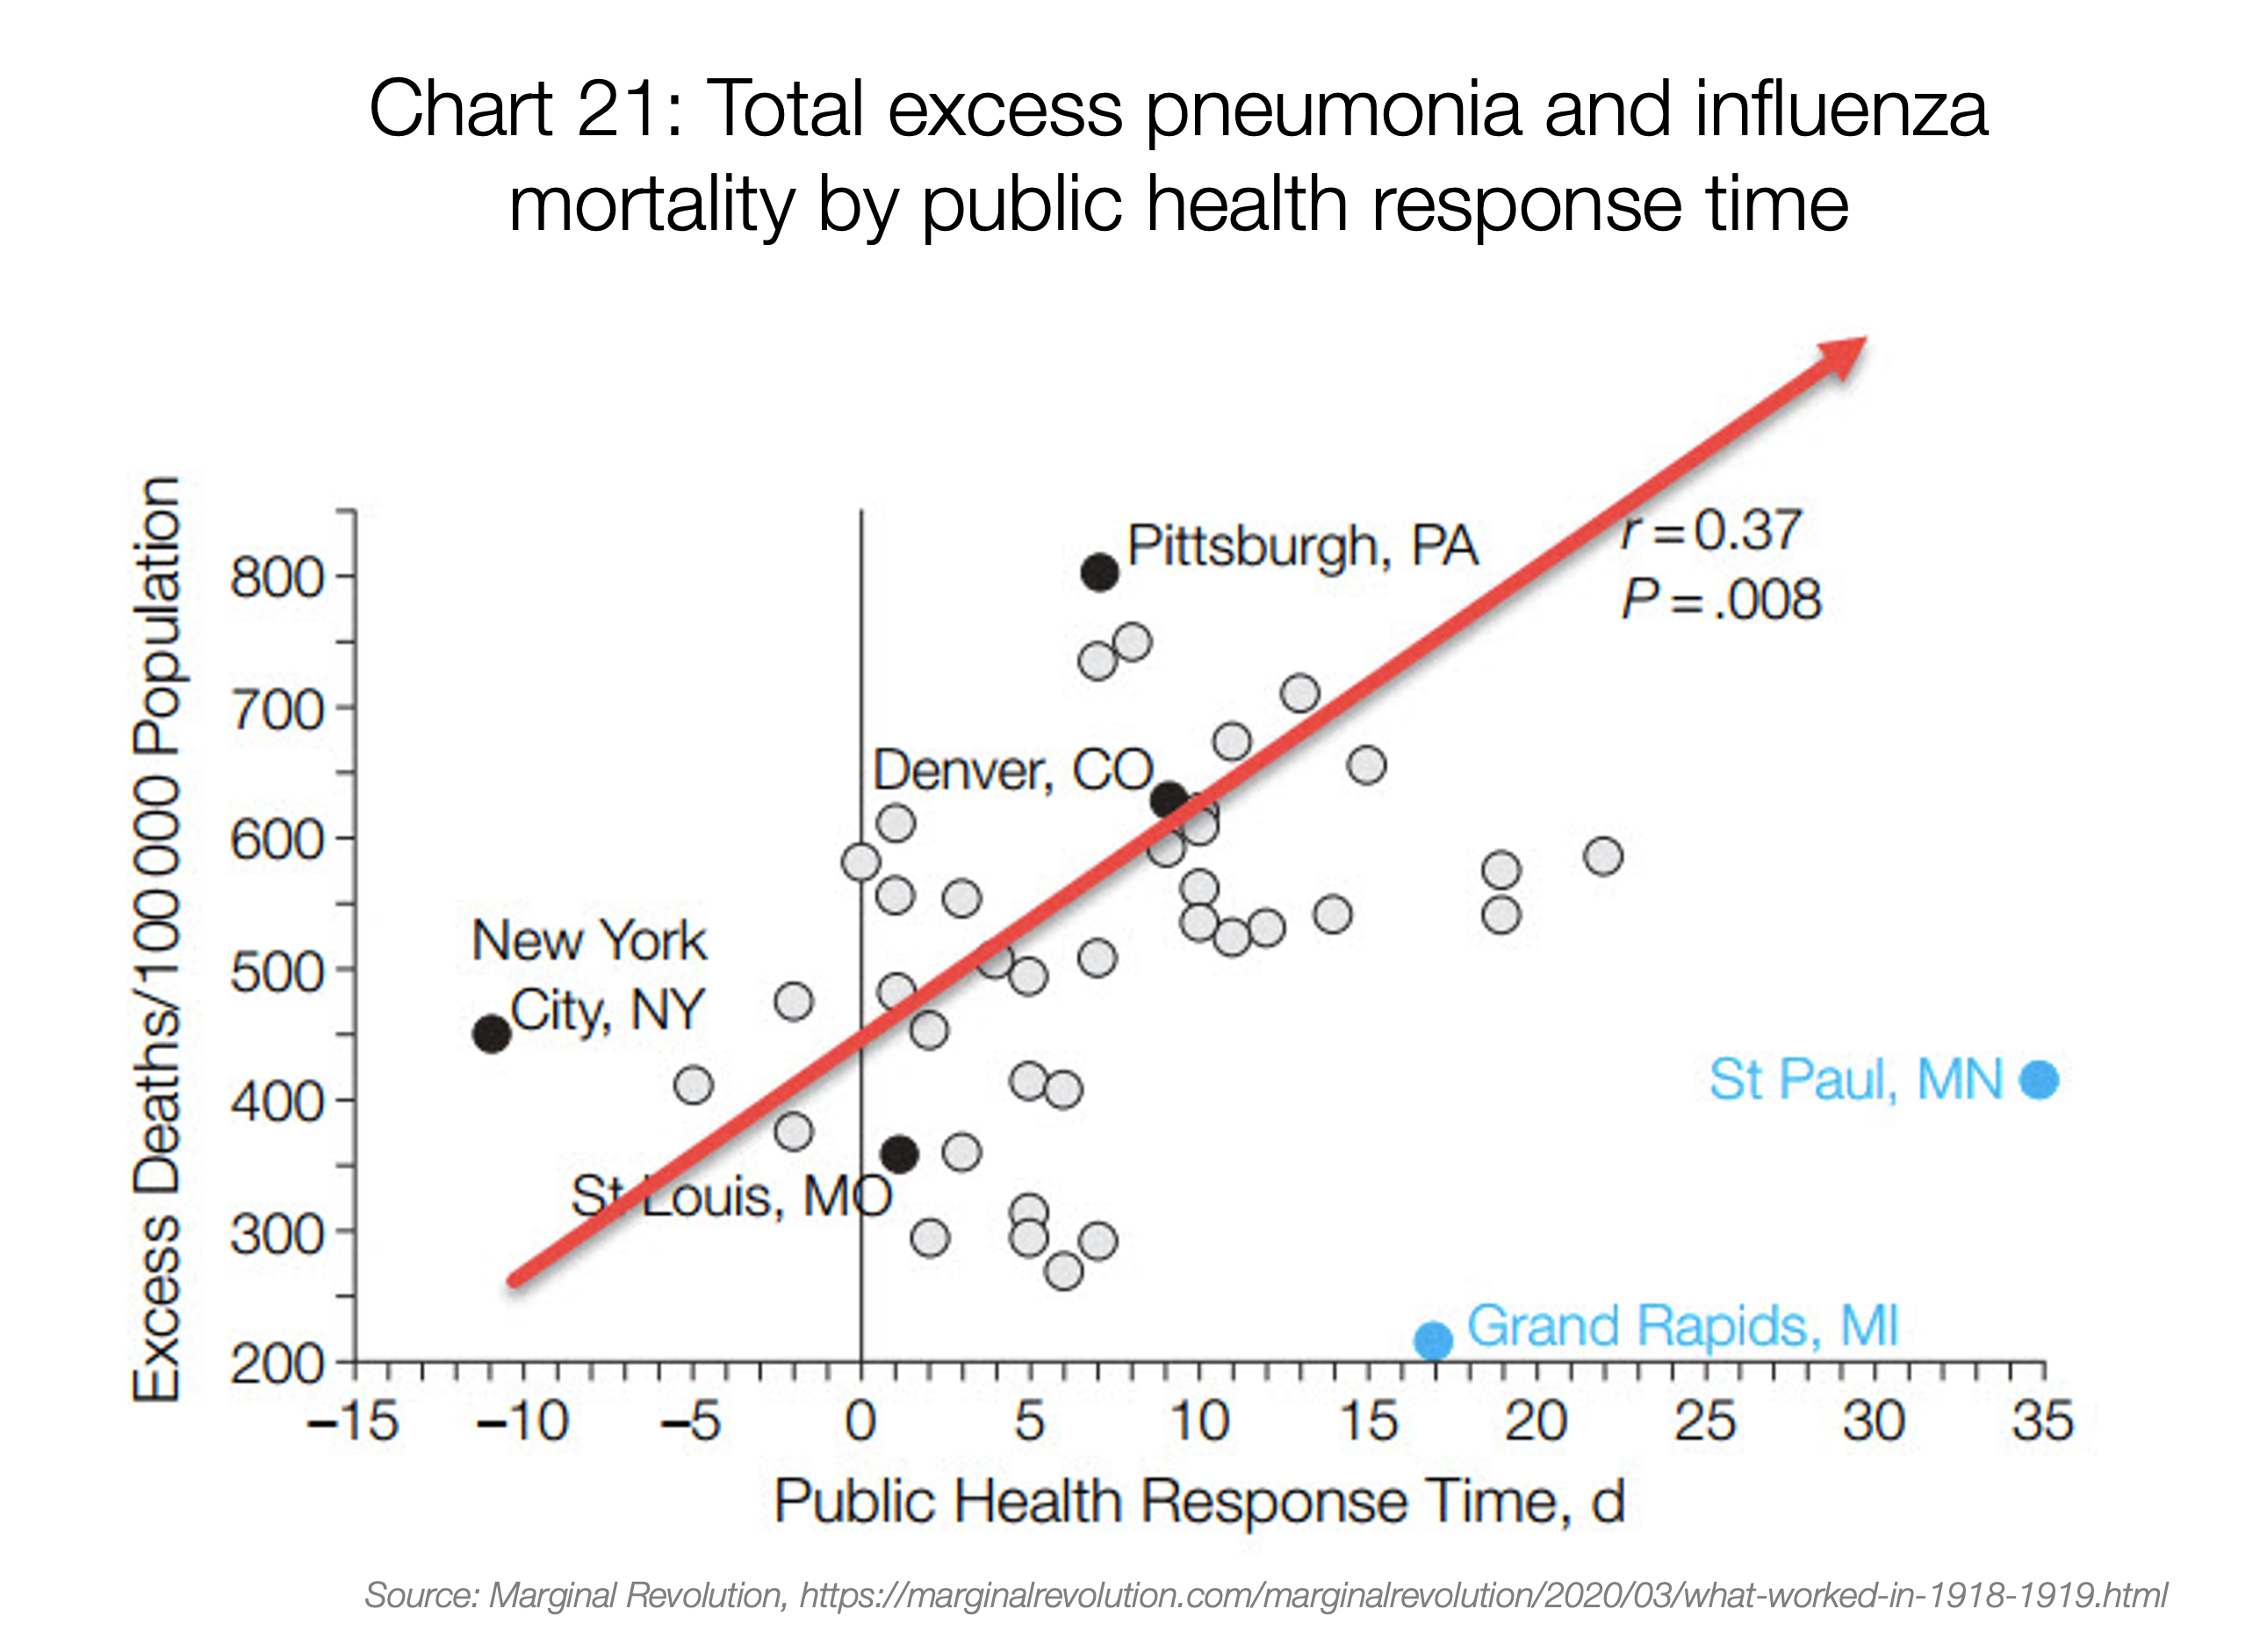
The chart shows flu mortality in the US in 1918 depending on how quickly measures were taken. On average, taking measures 20 days earlier cut mortality in half.
Italy finally figured this out. First they isolated Lombardy on Sunday, then a day later on Monday, they realized their mistake and decided they needed to lock down the entire country.
Hopefully in the coming days we'll see results, but generally it will take one to two weeks. Remember the Wuhan chart: there was a 12-day delay between the lockdown announcement and when official cases (orange bars) started declining.
How Can Politicians Facilitate Social Distancing?
If you're a politician in a region affected by the coronavirus, you should immediately follow Italy's example and order a national lockdown.
Here's what the Italians did:
- Nobody can enter or leave quarantine zones unless they can prove family or work-related reasons.
- Movement within zones should be avoided unless justified by urgent personal or work reasons that cannot be postponed.
- People with symptoms (respiratory infection and fever) are "strongly advised" to stay home.
- Standard leave for healthcare workers is suspended.
- Closure of all educational institutions (schools, universities...), gyms, museums, ski resorts, cultural and social centers, swimming pools, theaters.
- Bars and restaurants have limited operating hours from 6 AM to 6 PM, with at least one meter (~3 feet) distance between people.
- All pubs and clubs must be closed.
- All commercial activity must maintain at least one meter distance between visitors. If a business cannot ensure this, it must close. Temples may remain open as long as they guarantee this distance.
- Visits from relatives and friends to hospitals are restricted.
- Work meetings must be postponed. Remote work must be encouraged.
- All sporting events and competitions, public or private, are canceled. Important events may be held behind closed doors.
These are the minimum measures that should be taken. If the goal is to ensure safety, follow the Wuhan model. People may complain now, but they will be grateful later.
How Can Business Leaders Facilitate Social Distancing?
If you lead a team and want to know what you should do, the best resource for you is Staying Home Club.
This is a list of American tech companies that have enacted social distancing policies — so far there are 85. Policies range from allowing remote work and limiting office visits to canceling business trips or corporate events.
There are several other things every company must decide, such as what to do with hourly workers, whether to keep the office open, how to conduct interviews, what to do with cafeterias... If you're interested in how my company handled some of these issues, you can review our policy and sample announcement.
4. When?
It's quite possible that you've agreed with everything said above and have been wondering from the start when to make each decision — or in other words, what should trigger each measure.
Risk-Based Decision Model
To solve this, I created a model (here's a direct link to copy the model).
It allows you to estimate the likely number of cases in your area, the probability that your employees are already infected, and how the situation will evolve over time. All of this should tell you whether it's time to lock down the office.
The model tells us things like:
- If your company has 100 employees in Washington State, where 11 coronavirus deaths have occurred, there's a 25% probability that at least one of your employees is infected, and you should close immediately.
- If your company has 250 employees mainly in the South Bay (San Mateo and Santa Clara counties, which together have 22 official cases, with the real number likely at least 54), by March 9th you'll have approximately a 2% chance that at least one employee is infected.
- If your company is in Paris and has 250 employees, today the probability that one of your employees has coronavirus is 0.85%, and by tomorrow it will be 1.2%, so if you're only comfortable with a 1% probability, you should close your office by tomorrow.
This model uses labels like "company" and "employee," but it can be used for anything else: schools, public transit... So if you have only 50 employees in Paris, but all of them ride the metro, encountering thousands of other people, then obviously the probability that at least one of them is infected is much higher, and you should close your office immediately.
Are You Part of a Leadership Group?
The proposed model is rather selfish. It examines the risk for each company individually, taking on as much risk as we want, until the inevitable hammer of coronavirus closes our offices.
But if you're part of a group of entrepreneurs, sit on a holding company's board of directors, or belong to a political faction, your calculations aren't for a single company but for an entire group. The math changes: what's the probability that any of our companies has an infection? If you manage a group of 50 companies with an average of 250 employees, in the San Francisco Bay Area the probability that at least one company has an infected employee is 35%, and the probability of it happening next week is 97%. I specifically added a tab to the model to play with this scenario as well.
Conclusion: The Cost of Waiting
Making a decision today can be scary, but you should think about this problem differently.
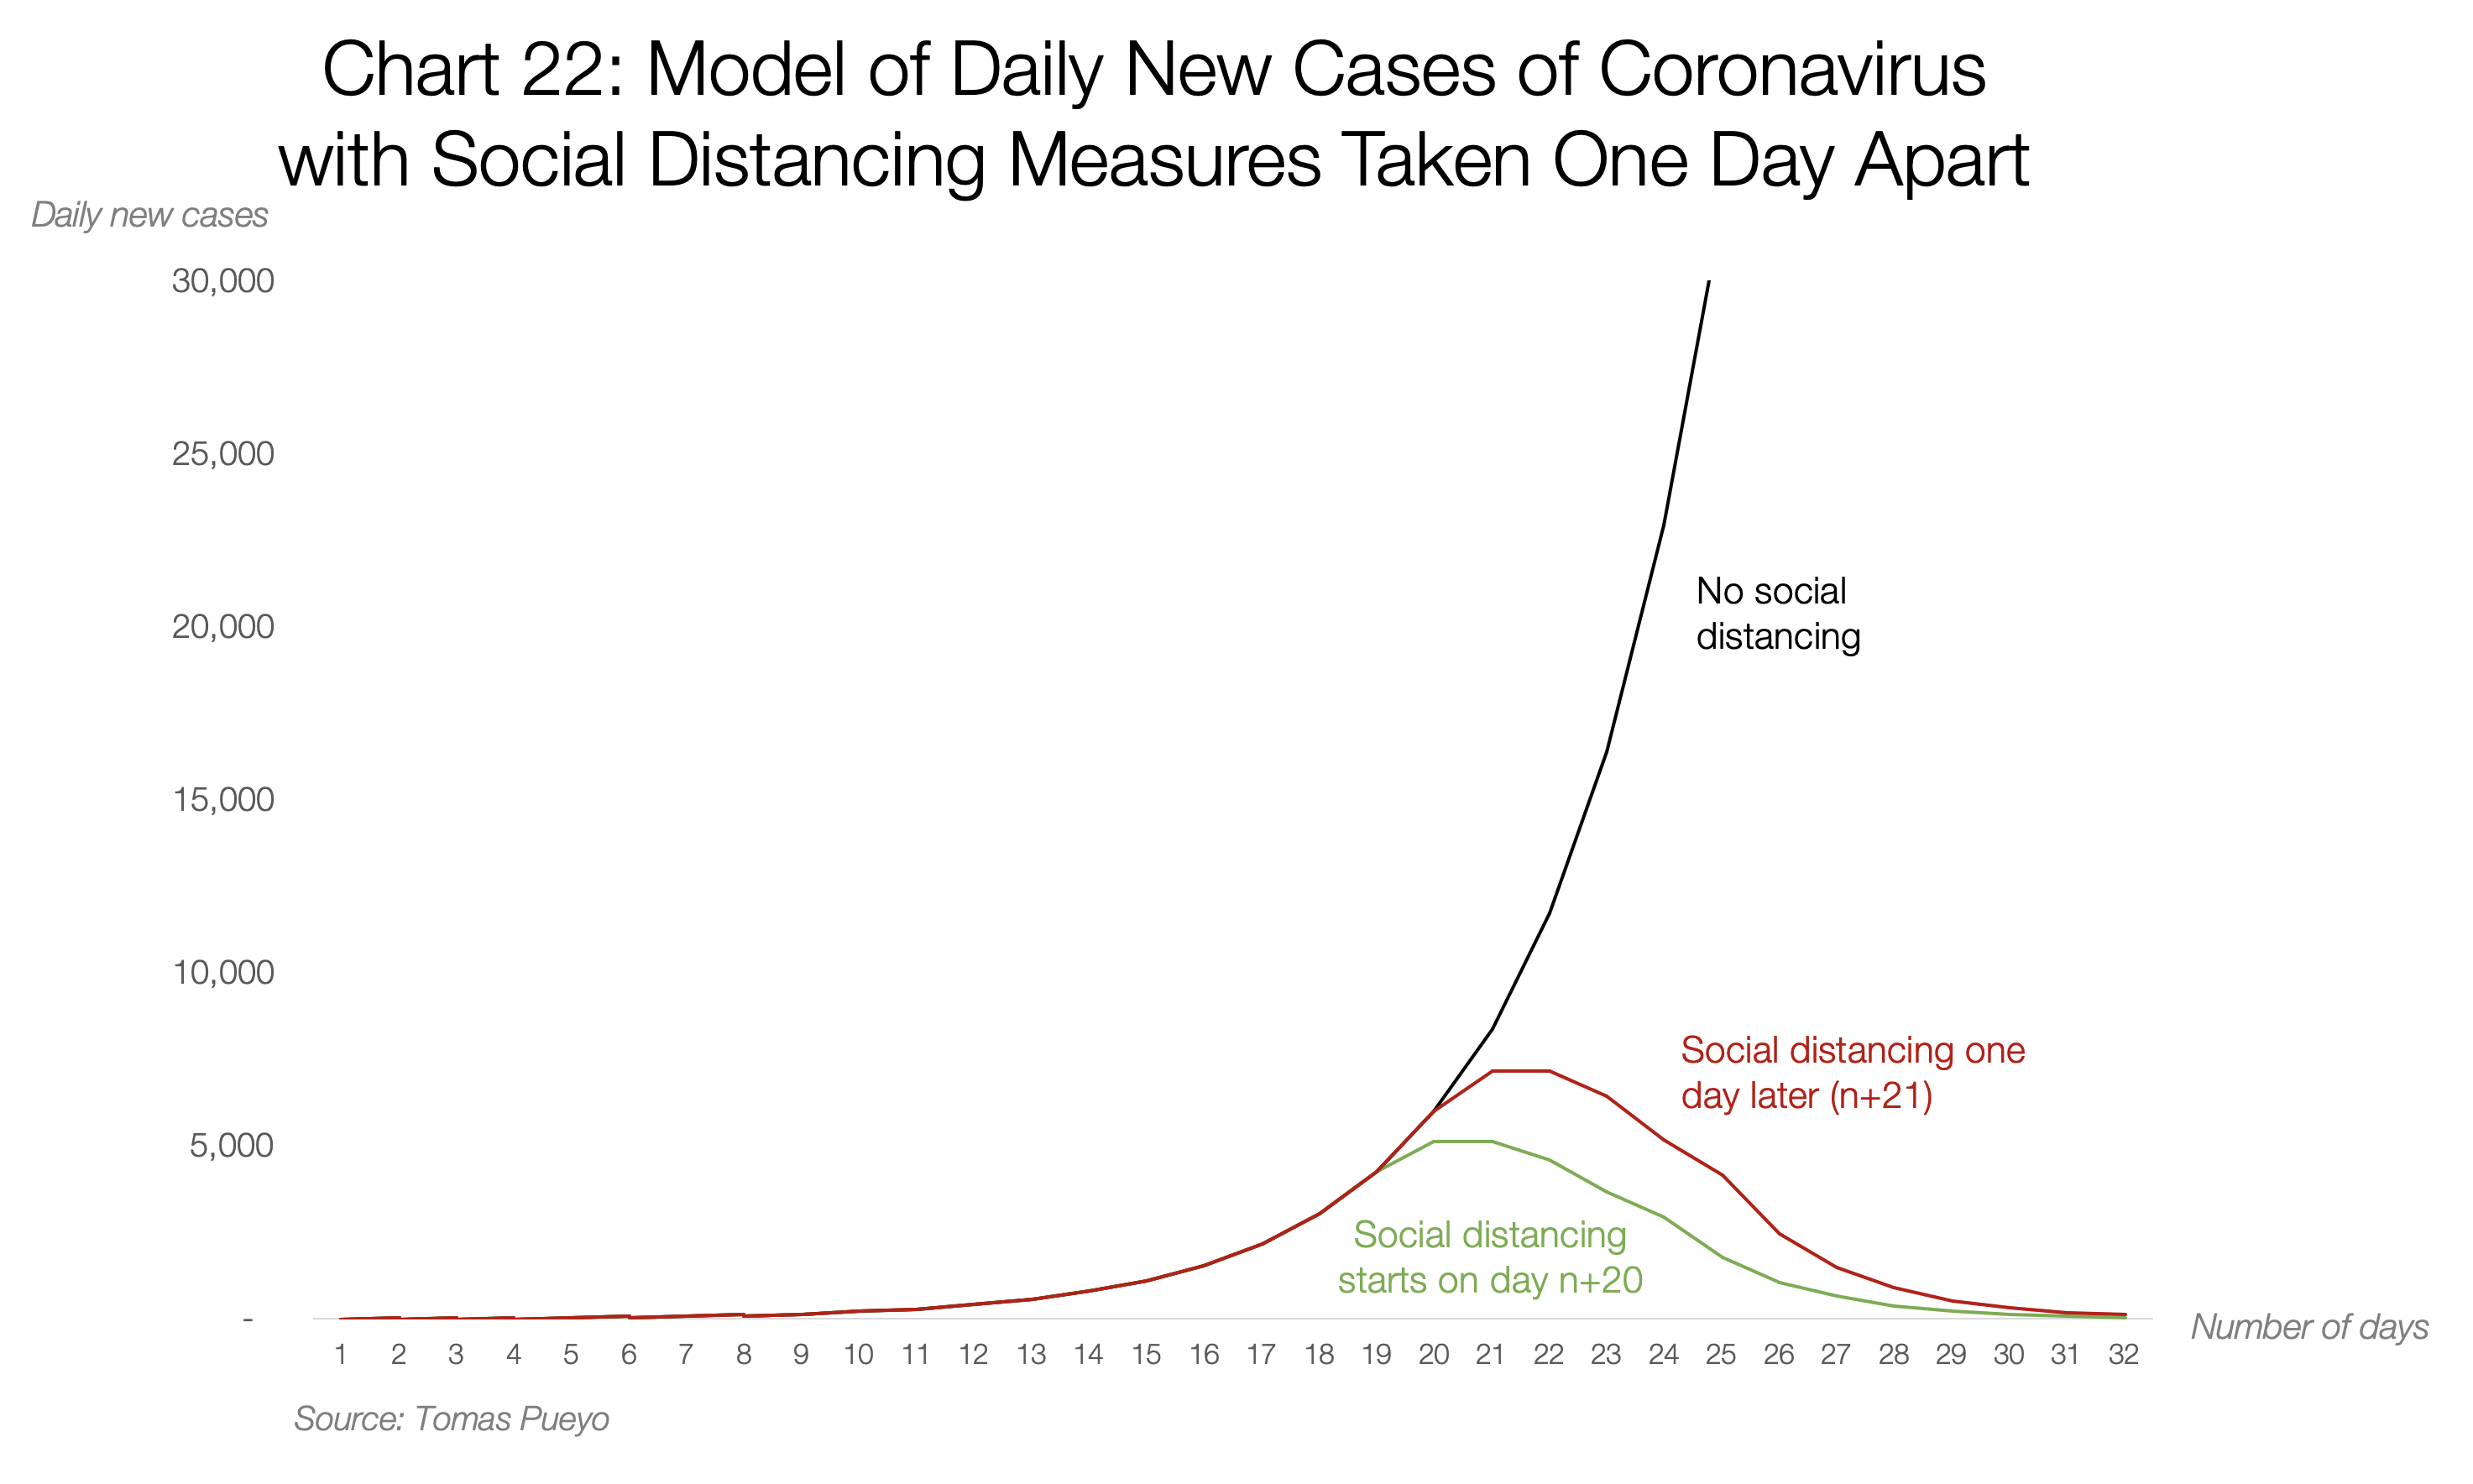
This theoretical model shows different communities: one takes no social distancing measures, another implements them on day N of the outbreak, and the third on day N+1. All numbers here are completely fictional (they were chosen to roughly resemble what happened in Hubei, with approximately 6,000 new cases daily in the worst case). This is just an illustration of how important a single day can be when something is growing exponentially. You can see that a one-day delay peaks later and higher, but then daily cases converge to zero.
But what about the cumulative number of cases?
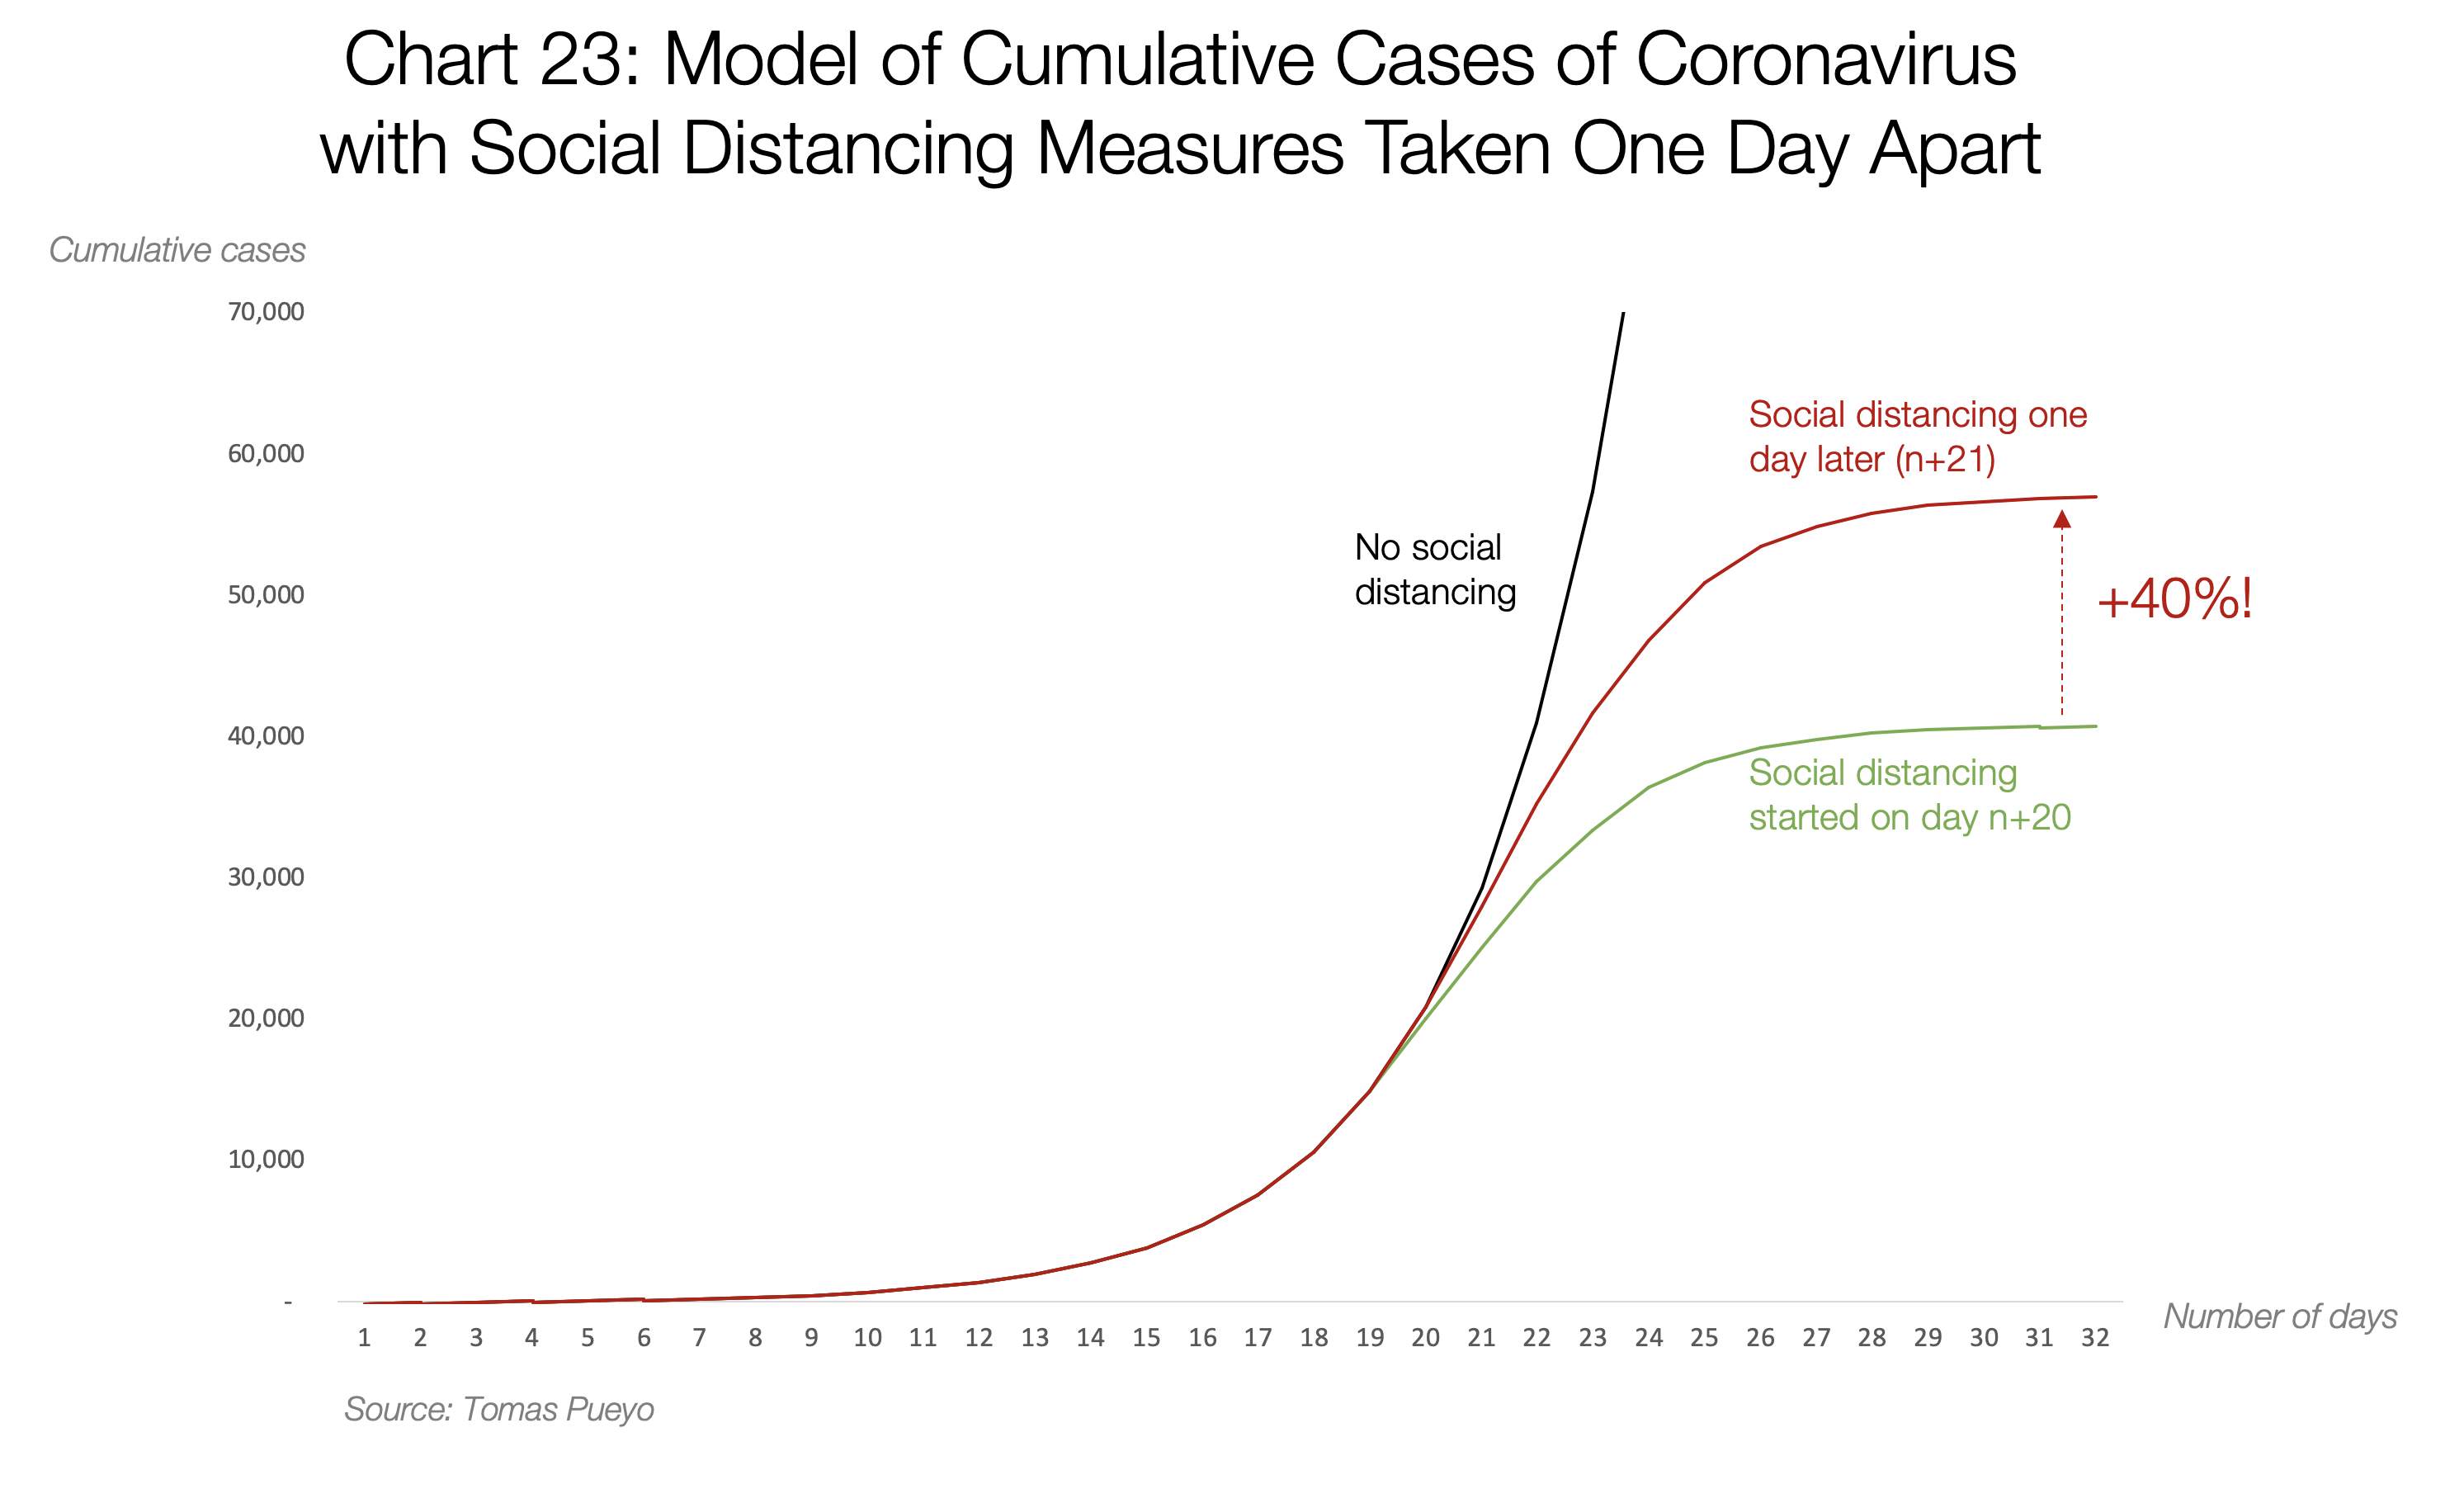
In this theoretical model, loosely resembling Hubei, waiting just one day creates 40% more cases! Perhaps if the Hubei authorities had declared a lockdown on January 22nd instead of January 23rd, they could have reduced the number of cases by a staggering 20,000.
And remember, this is just the number of infections. Due to the delay, the fatality rate would be much higher, and we're not just talking about the direct effect — deaths would increase by more than 40%. The inevitable collapse of the healthcare system would be more critical, leading to a 10x increase in fatality rate, as we saw earlier. So just a one-day delay in implementing social distancing can end with an explosive increase in deaths in your community, multiplying infections and driving up the fatality rate.
This is an exponential threat. Every day counts. When you postpone a decision by one day, you're not contributing to just a few cases of infection. There may already be hundreds or thousands of cases in your community. Every day without social distancing, those cases continue to grow exponentially.
Share This Information
This is probably the only time in the last decade when sharing a text can save lives. Everyone needs to understand what's at stake so we can prevent a catastrophe. We must act now.